
California’s State and Local Liabilities Total $1.5 Trillion
We estimate that California’s total state and local government debt as of June 30, 2017 totaled just over $1.5 trillion. That total includes all outstanding bonds, loans, and other long-term liabilities, along with the officially reported unfunded liability for other post-employment benefits (primarily retiree healthcare), as well as unfunded pension liabilities.
This represents a rise of about $200 billion – or 15% – over our last debt analysis, in January 2017.
Our findings may appear to contradict reports that suggest a state budget surplus of about $9 billion. But the state’s spare cash and rainy day funds pale before the mountain of long-term liabilities that California governments at all levels have accumulated. Moreover, if the stock market drops, personal income tax and capital gains tax revenue will decline precipitously, wiping out these surpluses.
Our analysis differs from government reporting in a few ways, the most significant of which is governments’ use of a very generous expected rate of return on their pension fund investments. Using a more accurate rate, we calculate the total of unfunded pensions in California at $846 billion – $530 billion more than the official estimate of $316 billion. But even using only the officially reported estimates, California’s state and local governments are about $1.0 trillion in debt.
California’s Total State and Local Government Debt – 6/30/2017 Estimate
Depicted below are the totals for California’s state and local government debt as of 6/30/2017. Without any revision to the officially estimated total for unfunded pension liabilities, the total is $981 billion. We have added to that total another $530 billion, however, to reflect what may be a more realistic estimate of total pension obligations.
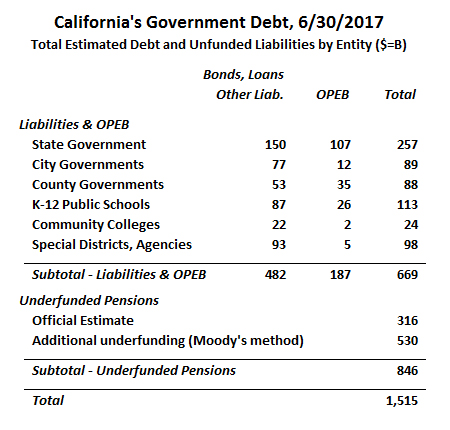
Moody’s, the credit rating agency, discounts pension liabilities with the Citigroup Pension Liability Index (CPLI), which is based on high grade corporate bond yields. When Moody’s first introduced its pension methodology a few years ago, the CPLI was 5.67%. More recently, CPLI has fallen: in June 2017, it was 3.87%.
Using the CPLI discount rate, we estimate that the real unfunded actuarial accrued liability (UAAL) for California’s state and local employee pension systems is $846 billion, which is $530 billion more than the officially reported (the method for restating UAAL based on a different discount rate assumption is described here). An alternative approach used by the Stanford Institute for Economic Policy Research (SIEPR) is to discount the liabilities by a rate closer to the risk-free rate. In a recent report, Stanford researchers used a discount rate of 3%. Using Stanford’s methodology, we estimate a UAAL of $1.26 trillion.
California’s largest pension system, CalPERS, has already told participating agencies they will be required to increase required employer contributions to the retirement fund. This will likely lead to budget cuts that will reduce government services and employment.
A California Policy Center analysis released earlier this year extrapolated those officially announced rate increases to estimate that in aggregate, California’s state and local government employers will be required to nearly double their annual pension contributions between 2017 and 2024, from an estimated $31 billion in 2017 to $59 billion in 2024.
Comparisons to Previous California Policy Center Debt Studies
This is the third time the California Policy Center has produced a compilation of all California’s state and local government debt. Because our methodology has evolved over time, our current estimate is not fully comparable to previous estimates. For example, in this study we included approximately $42 billion of “other long-term liabilities” that we previously excluded. These other long-term liabilities include unpaid employee sick leave (known as “compensated absences”), workers compensation claims payable and pollution remediation obligations.
While a precise comparison between the current and previous studies is not possible, we can note a couple of overall trends:
- Bonded debt obligations have risen very modestly during the last few years, as new issues have been largely offset by repayments of existing bonds.
- Pension obligations have risen mostly because of lower discount rates.
- The CPLI declined from 5.67% on June 30, 2011, the relevant date in our first study, to 3.87% on June 30, 2017.
- CalPERS, CalSTRS and many other California pension systems have made smaller reductions in their assumed rates of return used to produce official pension liability estimates.
- Finally, we have seen an increase in unfunded OPEB obligations as healthcare costs rise.
Heavily and lightly indebted local governments
Debt burdens vary greatly across agencies. One way to compare debt burdens between agencies of different sizes is to use the ratio of the entity’s long-term obligations to total revenue. Most California governments have reported debt-to-revenue ratios below 200%.
One local government with an especially large debt load is Los Angeles Community College District. In the 2017 fiscal year, LACCD reported $1.4 billion in revenues, mostly from property taxes as well as state and federal aid. The district’s balance sheet includes $4.2 billion of bond and capital lease obligations – yielding a debt to revenue ratio of 300%.
But if we also consider pension and OPEB debt the situation is even worse. LACCD’s balance sheet includes $641 million of net pension liabilities, but these are calculated using CalPERS and CalSTRS discount rates which were about 7% in 2017. If we recalculate these obligations using Moody’s methodology, the district’s pension debt triples to around $2 billion.
LACCD’s balance sheet also shows a $100 million OPEB liability. But this is just a fraction of the district’s Unfunded Actuarially Accrued OPEB liability of $568 million. Starting in the 2018 fiscal year, LACCD will be required to reflect the full liability on its balance sheet under new governmental accounting standards.
Finally, the LACCD has over $60 million in other long-term liabilities including compensated absences, workers compensation and a supplementary retirement plan. All told, the district’s long-term obligations can be fairly estimated at $6.8 billion or almost five times revenue. It is notable that despite LACCD’s apparently dire finances, its general obligation bonds carry relative strong credit ratings: AA+ from Standard & Poor’s and Aa1 from Moody’s. Because these bonds are serviced by a lien on properties within the district boundaries, they would continue to be serviced even if LACCD went bankrupt, lost accreditation or faced some other extreme circumstance.
Not all community college districts are so deeply indebted. At the other extreme, Feather River Community College District reported $14 million in long term liabilities versus $25 million in revenue. Although the pension portion of its debt would increase sharply if restated using Moody’s methodology, most of its unfunded OPEB liability is already on the district’s balance sheet. Feather River pays only a portion of the medical benefits for retirees before they become eligible for Medicare and nothing thereafter. Only relatively small community college districts like Feather River have low debt levels; LACCD’s high debt burden is more typical of California’s larger Community College districts.
Debt also varies widely among the state’s cities. Santa Paula, a small city in Ventura County, reported $160 million in long term liabilities, more than quadruple municipal revenue. Most of the debt took the form of water and wastewater revenue bonds. Reported OPEB obligations were less than $1 million while pension debt was just under $23 million. The reported pension obligation is based on a discount rate of 7.65% and would more than triple if the more conservative Moody’s discount rate was applied.
The city’s debt service requirements may have contributed to its decision to turn its fire department over to the Ventura County Fire Protection District. According to a Ventura Local Agency Formation Commission staff report, the city has been unable to afford fire station upgrades or an additional station.
Other cities with high debt/revenue ratios include Cathedral City, West Covina and Woodland. By contrast, the City of East Palo Alto has relatively little debt despite its modest economic circumstances. The city’s median income is lower than the statewide average and well below that of neighboring communities. As of June 2017, East Palo Alto had no outstanding municipal bonds and did not offer retiree medical coverage. Pension debt accounted for most of the city’s $12 million in reported long-term liabilities, which represented about 30% of municipal revenue. Other cities with low debt burdens included Danville and Lafayette – which don’t provide defined contribution pension benefits – and Rancho Cucamonga – a city whose OPEBs are fully funded.
What does this all mean?
California’s state and local governments have done a surprisingly good job at managing their conventional debt growth over the past five years, but this progress has been more than offset by the growth in unfunded pension liabilities.
Taking into account what we consider to be more realistic discount rates to calculate unfunded pension liabilities, California’s total state and local government debt as of 6/30/2017 of $1.5 trillion was equal to 54 percent of California’s total gross state product in that year.
When added to publicly held federal debt as a percentage of US GDP, 75 percent, the overall state, local and federal government debt/GDP ratio for California is 129 percent. This amounts to a total per individual California resident of $38,344. Based on IRS Statistics of Income, it equates to a total per individual California taxpayer of $85,087. Put another way, if every California taxpayer were to make principal and interest payments on $85,087, based on a 30-year, 5 percent loan, it would cost each of them $5,520 per year prior to paying taxes for any ongoing government operations.
A recent survey by the Public Policy Institute of California (PPIC) found that most respondents preferred to spend California’s current surpluses on healthcare and community college, while only 21% wanted to pay down debt. Perhaps if Californians understood the true magnitude of government debt in our state, they would adopt a different point of view. We hope that our study of government financial statements and related documentation will help educate Californians about the true extent of our public debt.
About the authors:
Marc Joffe is a senior policy analyst at Reason Foundation. He is the former Director of Policy Research at the California Policy Center. In 2011, Joffe founded Public Sector Credit Solutions to educate policymakers, investors and citizens about government credit risk. His research has been published by the California State Treasurer’s Office, the Mercatus Center at George Mason University, the Reason Foundation, the Haas Institute for a Fair and Inclusive Society at UC Berkeley and the Macdonald-Laurier Institute among others. He is also a regular contributor to The Fiscal Times. Prior to starting PSCS, Marc was a Senior Director at Moody’s Analytics. He has an MBA from New York University and an MPA from San Francisco State University.
Edward Ring is a Contributing Editor and Senior Fellow with the California Policy Center. He is also a regular contributor to American Greatness. His work has appeared in the Los Angeles Times, the Wall Street Journal, Forbes, the Economist, Real Clear Politics, Politico, City Journal, Zero Hedge, and other media outlets. Ring has an undergraduate degree in political philosophy from UC Davis, and an MBA in finance from the University of Southern California.
* * *