
The Benefits and Costs of Oil and Gas Development in California
Summary: California is the nation’s third largest producer of crude oil and has considerable potential to expand production. This report assesses this potential by quantifying scenarios for crude oil and natural gas production both onshore and offshore and the associated economic and environmental impacts.
The oil production possibilities of the Monterey Shale recently have attracted considerable attention. If Monterey shale development remains at currently low levels, additional future production would be at most 50 thousand barrels per day. If producers solve the complex geology and engineering associated with this formation, production levels could reach 500 thousand barrels per day after 15 years. Finally, higher well productivity could boost production to slightly less than 1 million barrels per day by 2035. There are also substantial offshore reserves with considerably less production risk and a larger upside than the Monterey Shale.
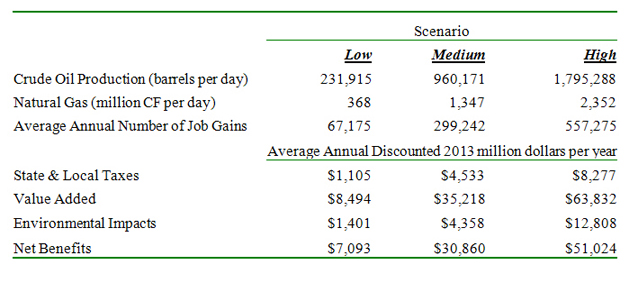
The combined development scenarios would generate significant economic benefits that are summarized in Table ES1. The average annual increase in employment ranges from 67 to 557 thousand. Average annual gains in state and local taxes are between $1.1 and $8.2 billion per year as value added or state domestic product increases from $8.5 to $63.8 billion depending upon the production scenario. The environmental impacts include greenhouse gas emissions associated with higher consumption of petroleum products and natural gas, the expected value of oil spill costs, and costs associated other environmental events, such as well blow–outs and breaches of well bores. Using mid-range estimates of carbon emission costs and other environmental damage estimates produced by the federal government and the peer reviewed literature, the average annual economic value of these environmental damages are from $1.4 to $12.8 billion per year (see Table ES1). These impacts are between 12 and 20 percent of value added, roughly on par with many royalty rates, which perhaps is a means to assuage environmental concerns. The net economic benefits defined as value added less the expected environmental impact costs are between $7 and $51 billion per year. Developing California’s oil and gas resources, therefore, provides significant net economic benefits to society.
Table ES1: Economic Contribution of Oil and Gas to California Economy in 2011
* * *
1. INTRODUCTION
New technologies have transformed the oil and gas sector in the U.S. economy from a sunset to a growth industry. Three-dimensional seismic technology, directional drilling, and multi-stage hydraulic fracturing have dramatically lowered the cost of extracting crude oil, natural gas, and natural gas liquids from previously inaccessible shale rock and other tight geological formations. Crude oil production is up considerably in several states, including North Dakota, Texas, Wyoming, Colorado, Utah, and New Mexico. Moreover, Pennsylvania, West Virginia, and Ohio are emerging as major producers of natural gas and associated liquids, such as propane, ethane, and butane.
The application of these technologies has led to dramatic increases in oil and gas production in the United States and a significant reduction in our nation’s trade deficit. In 2008, the US produced 6.78 million barrels per day of crude oil and natural gas liquids. Four years later, production averaged 8.91 million barrels per day, an increase of over 31 percent. Over this period, North America provided 75% of world oil production growth, which has been pivotal in keeping world oil prices from going any higher than they already are. Depending upon prices, oil and petroleum products comprise roughly half of our nation’s trade deficit. From 2007 through the first quarter of 2013, the trade deficit in crude oil and petroleum products had declined by almost 45 percent, which directly translated to higher gross domestic product here at home.
California is now the third largest oil producing state in the US, behind Texas and North Dakota. In contrast to many other major oil and gas producing states, California’s crude oil production had been declining prior to 2012. A slight uptick in production last year suggests that the technological innovations discussed above are being applied to the significant oil and gas resources remaining in California. Directional drilling offers the possibility of safely accessing a significant portion of the estimated 10 billion barrels of offshore oil and gas from land-based drilling rigs. Another opportunity is to develop the Monterey shale in the Central Valley region, which may hold up to 15 billion barrels of crude oil. At current market prices, these assets are worth $2.5 trillion, which, if monetized, could generate hundreds of billions in tax and royalty revenues to fund pensions, education, health, and other government programs. Developing oil and gas resources, however, involves environmental impacts on air, land, and water resources that impose costs on society. The central question of this study is whether the economic benefits of oil and gas development in California exceed the associated environmental costs.
The next section of this study defines the current state of the oil and gas industry in California and its contribution to the state’s economy. The third section describes future development scenarios for additional oil and gas production in California with a specific focus on state offshore resources and on the Monterey Shale. The fourth section estimates the economic impacts from these development scenarios. While a recent study from the University of Southern California estimates the economic impacts from developing the Monterey Shale, there are a number of problems with this study that require additional analysis. The fifth section of this study identifies the environmental impacts associated with these development scenarios, addressing two questions: 1.) Whether these impacts are manageable in terms of minimization of occurrence and implementation of remediation procedures, and 2.) Whether the remaining unmitigated impacts impose significant costs on the economy. The final section compares these costs and benefits, addressing whether accelerated development of oil and gas reserves is in the best interest of California and discussing how the state could achieve a balance between environmental quality, economic growth, and energy independence.
* * *
2. OIL AND GAS RESOURCES IN CALIFORNIA
California has a large and diverse economy, generating more than $1.9 trillion in value added, which is also known as gross domestic product. Over 19.5 million people are employed in the state. Since the economic recovery began in 2009, California’s economy has struggled. The unemployment rate is at 8.5 percent, well above the national average of 7.0 percent in December of 2013. Significant tax increases have been enacted to fund state pensions, schools, health care and other public expenditures. State policy makers have begun to look at the oil and gas sector as a potential source of future income to fund these public expenditures.
There are several ways to define the oil and gas sector. Some studies, such as Avalos and Vera (2013) define the oil and gas industry from wells to final consumers, including the refining sector and transportation of petroleum products. This study focuses on the upstream segment of the industry – drilling, support, and extraction – because the possible expansion of production discussed in the next section specifically involves these segments of the industry, not the refining and transportation of products. While expansion of the refining sector is possible from expansion of oil and gas extraction, displacement of imported crude oil without significant expansion of refining sector is the most likely outcome.
The economic contribution of the oil and gas sector is summarized in Table 1. Direct employment was 49,582, which was 0.3 percent of total employment in the state. Gross output, which includes purchases of goods and services from other sectors as well as the net contribution to the economy in terms of value added, came to $23.4 billion in 2011. Value added, which is the best measure of net economic contribution of an industry, was $12.6 billion in 2011, or 0.7 percent of total value added or gross state product. Oil and gas generated $1.9 billion in indirect business taxes, constituting 1.6 percent of total tax collections. While these statistics indicate that the oil and gas sector is a small component of the California economy, there are other ways in which additional oil and gas production can provide significant contributions to the economy.
California spent $104.7 billion on oil and natural gas during 2011. The gross output of oil and gas during 2011 was $23.4 billion (see Table 1). Hence, roughly $81.3 billion or slightly over 4 percent of gross state product flowed out of the California economy to pay for imported oil and natural gas to meet domestic needs. If these expenditures flowed to California oil and gas producers who hired workers and paid taxes within the state, California employment, gross state product, and tax revenues would be higher. Hence, increasing oil and gas production in California can cut the state’s energy trade deficit that would provide a direct stimulus to employment, income, and government revenues.
Table 1: Economic Contribution of Oil and Gas to California Economy in 2011

What are the prospects for increasing oil and gas production in California? The potential future production possibilities are significant. Humphries and Pirog (2012) report that California offshore areas contain 10.13 billion barrels of oil and 11.73 trillion cubic feet of natural gas. While oil and gas production offshore California continues, significant expansion is prevented by federal and state drilling moratoriums. Onshore there is the Monterey shale that may contain upwards of another 15 billion barrels of oil, according to the U.S. Energy Information Administration (2011). The development of this resource is just getting underway and faces significant technical challenges.
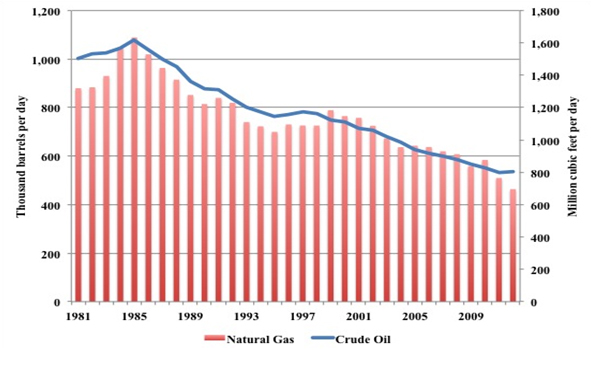
So while there is significant potential for expanded output, production of oil and gas has steadily declined as illustrated in Figure 1. Production of crude oil peaked in 1985 at 1.079 million barrels per day. Natural gas production also peaked in the same year at 1.6 trillion cubic feet. Like Texas and many other states, technological innovations could reverse these declines. Accordingly, the analysis in the next section develops some possible scenarios for future onshore and offshore oil and gas development.
Figure 1: Oil and Gas Production in California, 1981-2012
* * *
3. DEVELOPMENT SCENARIOS
The first stage of oil and gas development involves investment to drill wells and construct gathering lines and oil and gas processing facilities other than refineries. This investment spending increases gross output of the drilling sector and depends upon the number of wells drilled each year. Once production begins, oil and gas revenues are generated and payments are made to investors, landowners, and governments. In this second stage , gross output from the oil and gas extraction sector increases in line with oil and gas production. Drilling support services are tied to each of these two sectors. Accordingly, this study models the economic impacts from oil and gas development in two steps; first by increasing gross output in the drilling sector by the amount of investments in the drilling and completion of wells and second by increasing gross output in the oil and gas extraction sector by the amount of gross revenues generated from oil and gas sales. This approach requires the specification of a drilling plan and estimates for the production of oil and gas resulting from current and past wells both offshore and onshore.
3.1 Offshore Development
The development and production plans for offshore development are built upon a scenario developed by Schniepp (2009) for the production of oil offshore Santa Barbara using slant-drilling techniques from land-based rigs. These rigs would drill wells extending several miles offshore. The oil project envisioned by Schniepp (2009) involves developing roughly 1.5 billion barrels of oil reserves offshore Santa Barbara.
Three scenarios for offshore California oil development are considered in this study. These scenarios are intended to bracket the range of possible future outcomes, reflecting considerable geologic, technological, and economic uncertainties.
The low scenario is the one presented by Schniepp (2009), which involves investment outlays of $10.6 billion over a 16-year period, with annual investment spending peaking at about $1.5 billion (see Figure 2). Under this development plan, production rises by 400,000 barrels per day and tracks down to slightly over 50,000 barrels per day after 20 years (see Figure 3).
The medium scenario involves developing these reserves plus those offshore Los Angles and Long Beach with a three-year lag from the low scenario. The total reserves under this scenario are estimated to be 5 billion barrels. Under this case, total investment outlays are $34.4 billion (Figure 2). Production peaks at nearly 1.3 million barrels per day and remains above 150,000 barrels per day after 20 years (Figure 3).
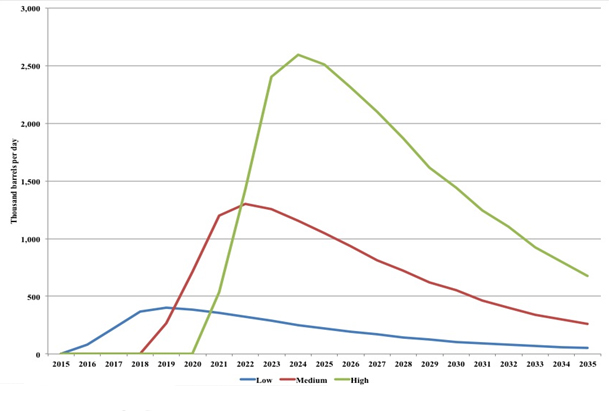
The high scenario assumes all 10 billion barrels of estimated oil reserves offshore California are developed. Given the infrastructure requirements, production in this scenario begins in 2021. This would require total investment outlays of $68.6 billion reaching nearly $10 billion in the early years (see Figure 2) and resulting in annual production peaking at roughly 2.6 million barrels per day and remaining well above 300,000 barrels per day after 20 years (Figure 3). While these cases may be dismissed as unlikely given the opinion in California of some people that is highly critical of offshore drilling, these scenarios provide a basis for estimating the opportunity costs of these views.
Figure 2: Offshore Oil and Gas Investment Outlay Scenarios, 2015-2035
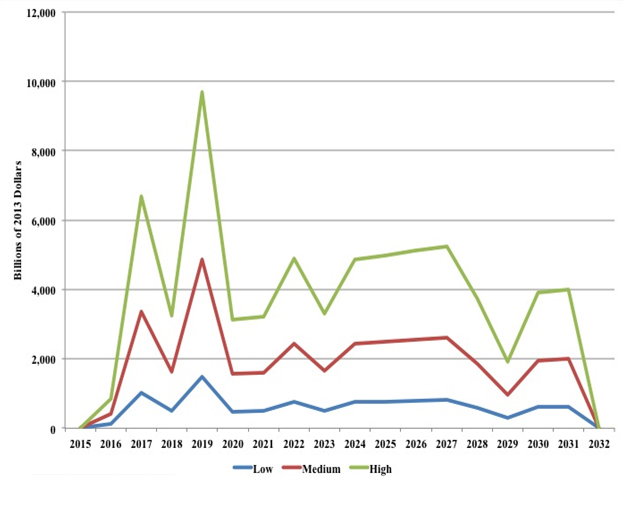
Figure 3: Offshore Oil and Gas Production Scenarios, 2015-2035
3.2 Development of Monterey Shale
Despite its significant potential, oil production offshore amounted to only 36 thousand barrels per day in 2012. Onshore production in 2012 was 504.9 thousand barrels per day. Nearly 80 percent of this output comes from the southern San Joaquin Valley resting above Monterey Shale, which is considered the source rock for conventional oil production in the region. The active area for the Monterey Shale is approximately 1,752 square miles. Assuming 16 wells per square mile and 550 thousand barrels of estimated recoverable reserves (EUR) of oil per well, the US Energy Information Administration (2011) estimates that this shale play contains 15.42 billion barrels of technically recoverable oil.
Currently there is considerable uncertainty about whether this oil can be produced. Some geologists believe most of the oil has already migrated to conventional reservoirs. Hughes (2013) argues that the potential of the Monterey has been overstated, citing historical production statistics that only 145 thousand barrels of oil have been recovered from producing wells. Occidental Petroleum, which holds 78 percent of the net leasehold acreage, however, is optimistic about the future production potential of the Monterey. The reason for their optimism most likely is based upon the promise of applying more advanced oil recovery technology, which was not employed for the wells covered by the data sample that Hughes (2013) collected.
A crucial unknown in projecting possible future production profiles for the Monterey shale is the amount of oil recoverable per well. Since there is little doubt that technology has improved considerably since the samples collected by Hughes (2013), this study assumes that Monterey wells drilled beginning in 2015 will average 250 thousand barrels EUR, less than half the EIA estimate but significantly above the average computed by Hughes (2013). Based upon experience in other shale plays reported by Considine et al (2011), technological innovations and learning by operators likely would increase recoverable reserves.
This study assumes three scenarios for the track of recoverable reserves per well over the forecast period summarized below in Figure 4. Under the low scenario, average EUR increases from 250 thousand barrels to 300 thousand after 20 years in 2035. Under the medium scenario, operators crack the code and average EUR increases to 350 thousand barrels by 2020 and then grows one percent per annum, reaching 400 thousand barrels by 2035. The high scenario envisions an even faster ramp-up in EUR to 450 thousand barrels by 2020 and then a gradual increase to 500 thousand barrels per well. Allowing for technical progress that improves well productivity is a reasonable approach based upon experience from other shale plays around the US, such as the Eagle Ford and Marcellus.
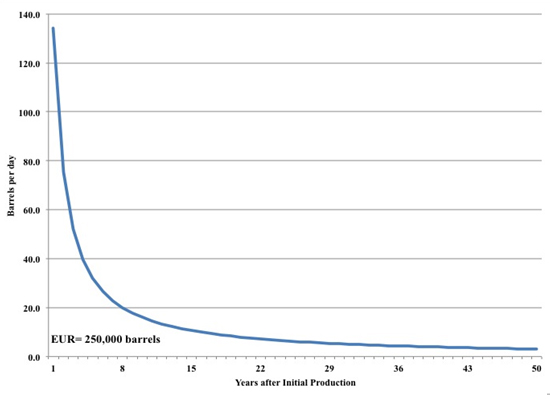
The next critical assumption for building a production forecast involves the production decline curve, which is presented below in Figure 5. The area under this curve is the estimated recoverable reserves, which in the base year 2015 is 250 thousand barrels. During the first three years of production, wells are assumed to average 134, 75, and 52 barrels of crude oil production per day. Production in subsequent years then gradually declines (see Figure 5).
Figure 4: Assumptions for Estimated Recoverable Reserves
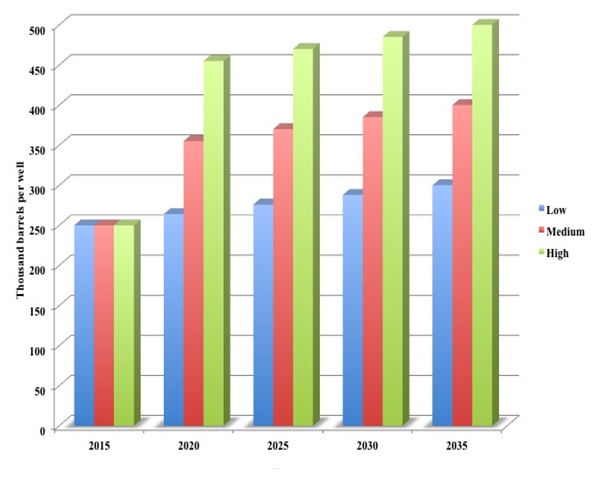
Figure 5: Hypothetical Monterey Shale Oil Production Decline Curve
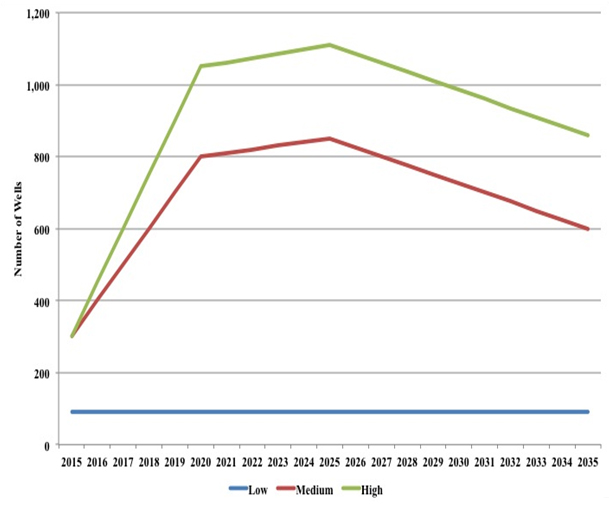
Given assumptions on EUR per well and the production decline curve, this study posits three drilling scenarios. The first or low case assumes only 90 wells are drilled per year under the low EUR scenario (see Figure 6). Under this scenario, the number of producing wells reaches 1,890 by 2035, which represents 6.7 percent of the 28,032 wells that EIA estimates could be drilled in the Monterey shale region. The medium scenario assumed 300 wells drilled in 2015, increasing by 85 each year to 2020, increasing by 8 per year between 2021 and 2025, then declining by 25 wells per year as productivity growth reduces the need to drill as many wells (see Figure 6). At the end of the forecast period in 2035, there are 14,575 Monterey wells producing, which is 52 percent of the maximum number possible. The high drilling scenario assumes the high EUR scenario and, therefore, a faster pace of drilling that reaches over a thousand in 2020, a gradual increase to 1,100 wells in 2025 and then a decline to 810 wells drilled in 2035 (see Figure 6). The number of producing wells in this scenario is 19,205, which is 68.5 percent of the maximum possible wells that could be drilled.
Figure 6: Monterey Shale Oil and Gas Drilling Scenarios, 2015-2035
Since well productivity and the number of wells changes change each year, each class of wells or vintage produces crude oil according to its production decline curve, the number of years since initial production, and the number of wells producing from that vintage. Accordingly, production of crude oil in each year going forward is computed by adding production across all well vintages. Associated natural gas production is assumed to be 0.859 thousand cubic feet per barrel of oil produced, which is the California state average from 2008 to 2012.
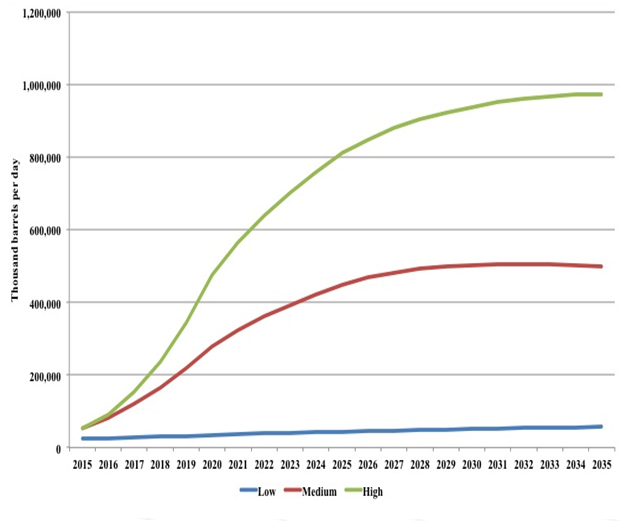
The results from these calculations are presented in Figure 7. Under the low scenario production gradually increases from 25 to 50 thousand barrels per day. The medium scenario has production rising to over 50 thousand barrels per day in 2015, 250 thousand barrels per day in 2020, and over 500 thousand barrels per day in 2035. The high scenario has production rising to over 470 thousand barrels per day by 2020 and approaching 1 million barrels per day by 2035.
Figure 7: Monterey Shale Oil Production Scenarios, 2015-2035
These production scenarios are considerably lower than the projections by Gordon et al (2013) that had production increasing from between 1.7 and 3.3 million barrels per day. Our findings support the contention by Hughes (2013) that the production forecasts by the team at the University of Southern California reported by Gordon et al (2013) are somewhat on the high side. Given that Gordon et al (2013) do not clearly describe their methods of production forecasting, it is difficult to determine the source of the differences between the two projections. In contrast to their analysis, this study makes explicit assumptions concerning EUR, employs a possibly more realistic production decline curve, and computes oil and gas output from a vintage production model. While advocates and opponents of oil and gas development can take exception to some of the assumptions made here, at least there is an explicit statement of the assumptions and a model supporting the analysis that allows a transparent quantification of the range of possible outcomes given technical and economic uncertainties.
3.3 Total Development Potential
The above results suggest that there is considerable potential for additional oil and gas production in California. Under the low scenario, Monterey Shale development shows modest productivity improvements and with development of oil reserves offshore Santa Barbara from onshore slant-drilling rigs, California would increase its oil production by 400 thousand barrels per day by 2020 (see Table 2). So even under modest development, California could increase its oil production by 75 percent over a short period of time.
Table 2: Potential Additional California Oil and Gas Production, 2015-2035
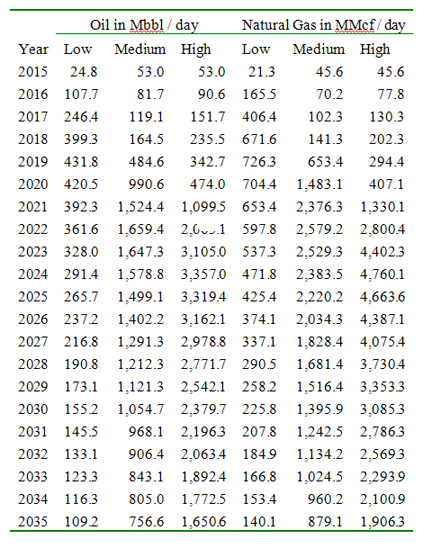
With a technological breakthrough in deciphering the complex geology of the Monterey Shale along with expansion of oil production offshore Southern California, oil production could soar by over 1.6 million barrels per day. Such an increase would rival the production gains witnessed recently in Texas and North Dakota. The high resource scenario would involve developing all of California’s offshore oil resources along with successful and relatively intensive development of the Monterey Shale. Under this scenario, California oil production could increase by over 3.3 million barrels per day. Combined with oil production already in place, California would emerge as one of the largest oil producing regions in the world. Although the resources are in place and the technology is in a position to monetize these resources, the central question is whether the California people and their elected officials would ever allow such development. Cynics would be quick to respond that such development is unlikely for political reasons, but public opinion can change, especially when the economic benefits of additional oil and gas production become apparent and environmental management policies are in place to assure responsible development.
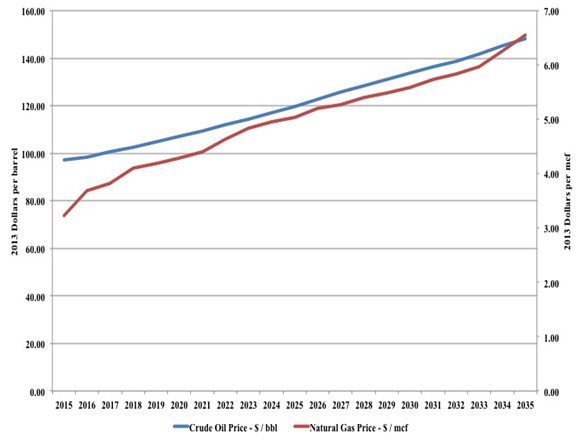
To determine the economic impacts of the production potential of California’s oil and gas sector, forecasts of prices for crude oil and natural gas are required. This study uses forecasts produced from the US Energy Information Administration (2013), which are plotted in Figure 8. Real oil prices rise from slightly under $100 per barrel in 2015 to over $140 per barrel by 2035. Similarly, natural gas prices increase from $3.5 per thousand cubic feet to over $6 per thousand cubic feet over the forecast horizon.
Figure 8: Oil and Natural Gas Prices, 2015-2035
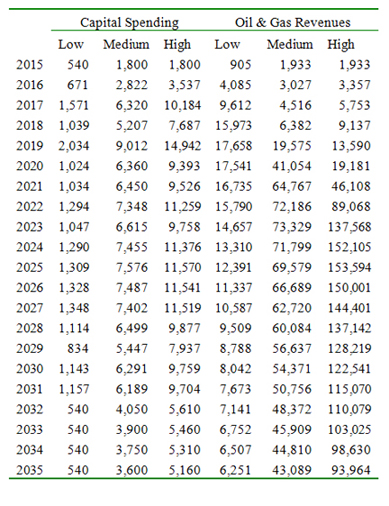
Given these price forecasts, incremental revenues from the three production scenarios appear in the last three columns of Table 3. The low scenario has incremental oil and gas revenues increasing by over $17 billion and then gradually declining to $6 billion by 2035. The medium scenario has a sharper increase in revenues to over $40 billion in 2020 peaking at over $73 billion three years later and then declining but remaining above $40 billion by 2035. The high scenario has revenues peaking over $150 billion in the early 2020s and then remaining well above $90 billion per year out to the end of the forecast horizon.
Also reported below in Table 3, are capital expenditures by the oil and gas industry to develop the Monterey Shale and offshore resources, if drilling moratoriums are lifted. These projections assume that each well costs $6 million to drill and complete. Capital spending begins at 540 million per year initially under the low scenario and ramps up to over $1 billion per year between 2020 and 2033. In total, oil and gas producers would invest over $21 billion over the entire period under this scenario. Capital expenditures are significantly higher under the medium scenario, amounting to over $120 billion from 2015 to 2035. Under the high scenario, capital spending is over $180 billion.
Since most of these expenditures would come from outside the state, they can be viewed as direct foreign investment in California’s energy production sector. As is well known in macroeconomics, a dollar of investment spending generates considerably more dollars as other business sectors supply the labor, raw materials, fuels, and materials to build these capital assets. Estimating these multiplier effects is the subject of the next section.
Table 3: Capital Spending & Oil & Gas Revenues in millions of 2013 dollars
* * *
4. ECONOMIC IMPACTS
The economic impacts of energy resource development involve two stages. First, there are the impacts on value added, jobs, and tax revenues during the construction of the energy producing facilities. During the second phase, economic impacts arise during the operation of these facilities as the income generated from these facilities is spent.
The spending during the construction and operation of energy production facilities will have several economic impacts. The direct capital expenditures will directly stimulate support industries. For example, capital expenditures for construction of oil and gas wells involve direct purchases from companies that provide capital equipment, engineering and construction services, and other goods and services. These companies in turn acquire equipment and supplies from other companies, stimulating several rounds of indirect spending throughout the supply chain. The direct and indirect outlays generate additional employment and income, which induce households to spend their income on additional goods and services. Together, these direct, indirect, and induced impacts during construction and operation constitute the total economic impacts of the energy investments.
Regional economic impact analysis using input-output (IO) tables and related IO models provides a means for measuring these economic impacts. Input-output analysis provides a quantitative model of the inter-industry transactions between various sectors of the economy. This framework provides a means for estimating how spending in one sector affects other sectors of the economy. This re-spending through the economy initiating from an exogenous increase in investment spending or production generates multiplied impacts on value added, employment, and tax revenues. IO tables are available from Minnesota IMPLAN Group, Inc. (2011) based upon data from the Bureau of Economic Analysis in the U.S. Department of Commerce. This study uses these tables to estimate the direct, indirect, and induced economic impacts from spending for the mineral development and eventual operation, which are summarized for California oil and gas in Table 4.
Table 4: Economic Multipliers for Drilling and Extraction in California
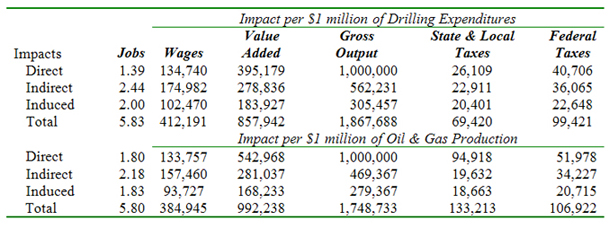
The multipliers in table 4 were computed by solving the IMPLAN model for California for a $1 million dollar increase in the gross output of the drilling sector and for a $1 million increase in the gross output of oil and gas extraction sector. Under the former solution, 5.83 jobs are required to support that $1 million increase in drilling activity. Likewise, value added increases by $857,942 and state and local taxes and federal taxes rise by $69,420 and $99,421, respectively. These multiplier impacts arise as industries supplying inputs to oil and gas drilling hire workers, pay taxes, and purchase supplies from other sectors to support this higher level of drilling activity. The multipliers for oil and gas extraction are similar in magnitude (see Table 4).
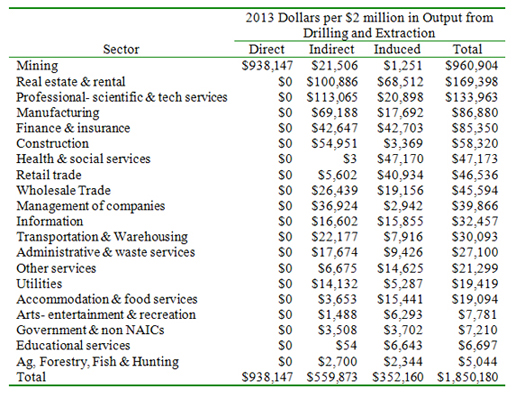
A more detailed look at the multiplied effects of the oil and gas sector on the economy is presented below in Table 5, which estimates the impact on value added by sector from a $2 million increase in oil and gas drilling and extraction. For the $2 million increase in oil and gas drilling and extraction, value added, which again is a measure of gross domestic product, increases by $960,904 (see Table 5). The next five largest impacts by sector include those affecting real estate, professional scientific and technical services, manufacturing, finance and insurance, and construction. Notice that for four of these top five sectors the total effects in the last column are dominated by the indirect impacts in column 3, reflecting the supply-chain linkages of these sectors with the oil and gas sector. In contrast, induced effects dominate the impacts on health and social services and retail trade as workers employed from the new activity in oil and gas and the related supply-chain industries purchase these services. Overall, the $2 million of additional oil and gas drilling and extraction increases total value added by $1.8 million.
Table 5: Impacts on Value Added by Sector
4.1 Economic Impacts of Offshore Development
Applying the multipliers in Table 4 to the capital spending and oil and gas revenues generated under the offshore development scenarios results in the estimated economic impacts presented in Table 6. The low development scenario that involves developing the 1.5 billion barrels of oil offshore Santa Barbara generates a peak of $16.5 billion in value added and slightly over 96 thousand jobs in 2020. This development generates $24 billion in state and local taxes and slightly over $20 billion in federal taxes over the 20-year period. After peak production, these economic benefits decline but remain significant with state and local tax revenue generation above $400 million in 2035.
Table 6: Economic Impacts of Offshore California Oil & Gas Development
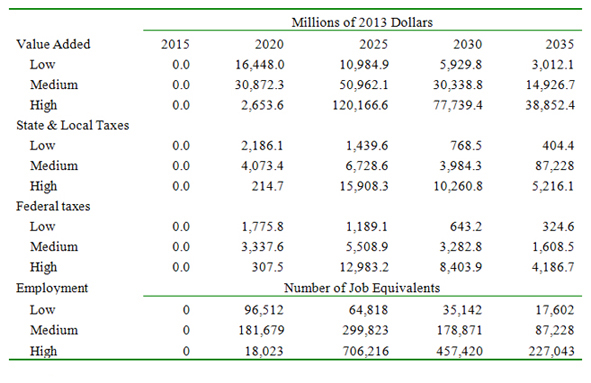
The medium development scenario that involves significant additional production offshore southern California generates substantially more value added and employment than the low scenario. Incremental value added exceeds $50 billion in 2025 and job gains are nearly 300,000. Given this higher economic activity, state and local tax collections increase by $80 billion over the twenty-year projection period. Under the high scenario, state and local taxes increase by $158 billion. Employment and value added gains are roughly double the gains achievable under the medium growth scenario.
While there has been focus recently on the potential of the Monterey Shale, the economic gains from developing the offshore resources are significant and probably entail relatively less technological uncertainties. On the other hand, the perceived threat from oil spills remains an ongoing concern but these risks can be substantially mitigated with onshore slant drilling to access these offshore reserves.
4.2 Economic Impacts from Developing the Monterey Shale
While fraught with considerable uncertainties arising from geology and petroleum engineering technology, if developed, the Monterey Shale could generate significant economic gains for the State of California. Even under the low development scenario at slightly increased levels of drilling and production from current activity, developing this resource would generate annual gains in value added of between $1 and $4 billion while supporting between 8 and 22 thousand jobs per year (see Table 7).
Table 7: Economic Impacts of Monterey Shale Oil & Gas Development
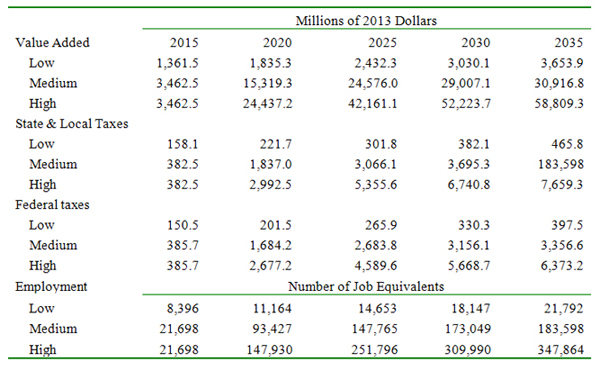
If producers developed cost effective methods for extracting oil from this particular shale represented under the medium scenario, the annual economic gains in terms of value added would be between $15 and $30 billion after five years (see Table 7). Cumulative state and local tax revenues would increase by $56 billion . Value added and employment also increases significantly under the medium scenario.
Under the high scenario, annual gains in value added exceed $24 billion by 2020 and rise to well over $50 billion in 2035. Also after 2020, employment gains are between 150 and 350 thousand. State and local tax revenues would increase by almost $100 billion over the entire 20-year forecast horizon.
These economic impacts are considerably smaller than those estimated by Park and Gordon (2013). The economic impact analysis in their study is driven by statistical regressions. A simple sensibility check using the data reported on page 55 of their report reveals that the net per capita GDP increase is $259.4 and the assumed per capita GDP increase in the oil and gas industry is $35.32. The total effect is 35.32 plus 259.4, which equals 294.72. This implies that the multiplier is 8.34 (294.72 / 35.32), which is well more than seven times larger than multipliers derived from IMPLAN or the Bureau of Economic Analysis for the oil and gas sector. So not only are the projections for oil and gas production from the study by Gordon et al. (2013) somewhat on the high side, so are the estimated economic impacts.
4.3 Total Potential Economic Impacts
The combined economic impacts from developing both the Monterey Shale and offshore oil and gas resources are summarized in Table 8. Near term, gains in value added, employment and tax revenues are relatively modest as technical uncertainties are resolved and infrastructure is constructed. Once these investments are completed, these projects could generate substantial benefits to the State of California. For example, under the medium development plan, value added or gross state product increases by $75 billion generating more than 440 thousand jobs, again via direct, indirect, and induced multipliers. Accumulated state and local tax revenues are $136 billion.
Table 8: Total Economic Impacts of California Oil & Gas Development

The high resource scenario generates substantially more incremental value added, employment, and tax revenues (see Table 8). Employment peaks at slightly more than 958 thousand in 2025, considerably smaller than the 2.8 million in job gains reported by Gordon et al. (2013) just for the Monterey Shale. State and local tax revenues increase by over $250 million over the entire projection period from 2015 to 2035. While the economic gains reported in this study are smaller than Gordon et al. (2013), they remain significant.
However unlikely this high resource scenario may be, this projection does point to the possibility that America could indeed become completely self-sufficient in oil, perhaps even a net exporter of crude oil in coming years. The high resource scenario in California combined with additional tight oil production from Texas to North Dakota, higher oil output from the Gulf of Mexico, an opening of the eastern seaboard of the US for drilling, and full development of oil reserves on the North slope of Alaska is a path to oil independence for the United States. Political interests, however, have blocked these pathways arguing that potential environmental impacts outweigh the economic benefits. To assess the reality of this proposition, the discussion now shifts to environmental concerns with developing oil resources in California, which provides a microcosm of the national debate surrounding oil and natural gas resource development.
* * *
5. ENVIRONMENTAL IMPACTS
The oil and gas production scenarios developed above will have a range of environmental impacts. The key question is whether the economic costs associated with these impacts are commensurate with the economic benefits estimated above. Producing and consuming oil and natural gas affect the natural environment, including air, land, and water resources. These impacts directly affect society by reducing the flow of services from these natural resources. For example, offshore oil production involves the risk of oil spills, which incurs cleanup costs and degrades water resources that would affect related economic activities, such as fishing and recreation. Likewise, additional oil production and consumption would increase emissions of greenhouse gases that contribute to global climate change.
Indeed one of the more cogent arguments against developing the untapped oil and gas in California is that additional production would add to greenhouse gas emissions when the world is trying to combat the impacts of global climate change. The extent of this increase, however, is somewhat tempered because higher California production would be partially offset by reductions in oil and gas production elsewhere. In other words, not all of the increase in California oil and gas production represents an increase in world consumption of these products. The extent of this offset depends upon how world supply and demand for oil and gas adjust to California production. Higher oil and gas production in California displaces imports and depending upon the size of the production increase reduces market prices, which discourages production outside California and increases world consumption. This study uses estimates for these market adjustments reported in the literature to estimate the net increase in world oil and gas consumption resulting from changes in oil and gas production in California. The methods used for these computations are reported in Appendix A that describes the changes in prices, demand, and production by region.
The associated changes in greenhouse gas emissions are directly proportional to these changes in net oil and gas consumption. In addition to greenhouse gas emissions, offshore crude oil production would incur costs associated with the risks of oil spills. Finally, there are costs associated with other environmental impacts from oil and gas production, such as land and water contamination from onshore spills and well blowouts.
5.1 Greenhouse Gas Emissions
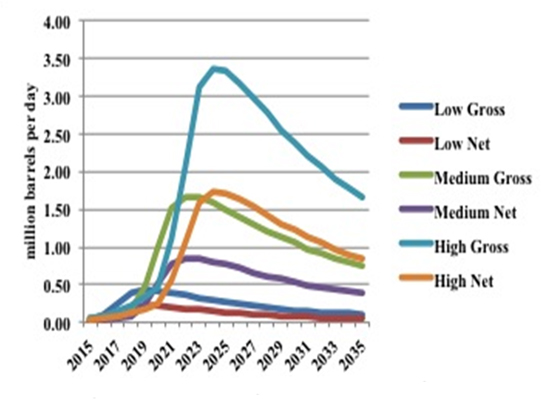
As the analysis above demonstrates, higher oil and gas production in California will increase value added, employment, and tax revenues. These gains, however, will come at the price of additional greenhouse gas emissions. The size of these emissions will depend upon how oil and natural gas markets adjust to higher California production. Given the market responses reported in the literature, roughly 50 percent of the increase in California oil production offsets production elsewhere in the world. Figure 9 summarizes the gross and net increases in world crude oil production for the three scenarios for onshore and offshore California production. Under the high production scenario, the gross increase in world production is 3.3 million barrels per day in 2024 but after accounting for reduced production elsewhere, the net increase in world production and consumption is 1.7 million barrels per day.
Figure 9: Gross and Net Increases in World Oil Consumption, 2015-2035
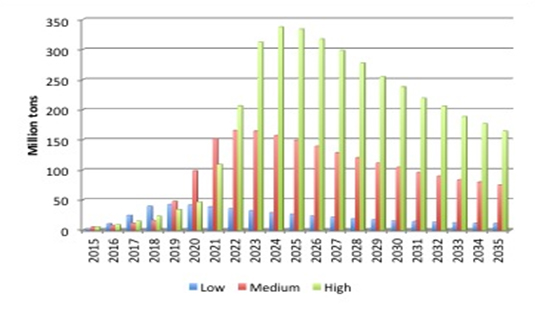
Corresponding with these increases in net world oil consumption are higher greenhouse gas emissions. Assuming 21.2 pounds of CO2 per gallon of crude oil consumed plus another 20 percent to reflect emissions during the production, refining, and transportation of petroleum products, results in the estimates for greenhouse gas emissions from higher California oil production illustrated in Figure 10.
Under the low production scenario, greenhouse gas emissions peak at over 40 million tons by 2020 and then track downward to roughly 11 million tons by 2035. Under the medium scenario, emissions peak at over 160 million tons by the early 2020s and then track down to 75 million tons by 2035. The high production scenario shows a sharp increase in emissions to over 330 million tons per year that like the other two scenarios declines with production but ends up with over 160 million tons per year. While these increases may seem large in an absolute sense, they are between 3 and 6 percent of the 5.279 million tons of total U.S. carbon dioxide emissions from energy consumption during 2012.
Figure 10: Greenhouse Gas Emissions from Higher Oil Production, 2015-2035
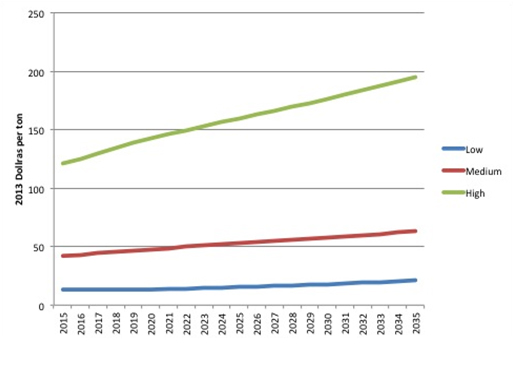
To place an economic value on these emissions and, thereby, compare the environmental impacts with the economic benefits, estimates of the costs of greenhouse gas emissions are required. For this, the Interagency Working Group on the Social Cost of Carbon (2013) provides the latest estimates that are summarized in the Figure 11. Under the low cost scenario, greenhouse gas emission costs slowly rise from $13 to $21 per ton. The medium scenario has emission costs rising from $42 in 2015 to $63 per ton in 2035. Finally, under the high cost scenario in which significant damages occur from global climate change, emission costs are $121 per ton and rise to nearly $200 per ton by 2035.
Figure 11: Prices for Greenhouse Gas Emissions, 2015-2035
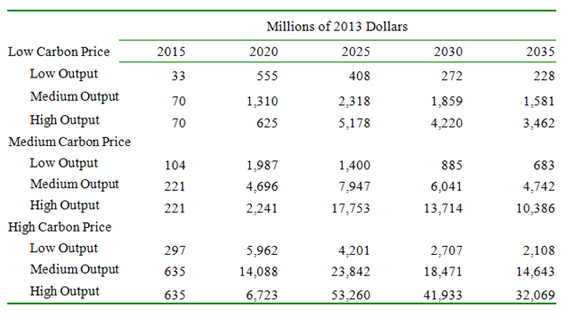
These emission costs per ton in Figure 11 and the estimated net emissions reported in Figure 10 allow an estimation of the valuation of the environmental impacts from higher California crude oil production. The low carbon cost or price scenario shows environmental impacts valued between $33 million and $5.178 billion dollars per year. These environmental impacts increase more than three-fold under the medium carbon cost scenario. The high carbon price scenario increases the value of carbon emissions to $23.842 billion in 2025 for the medium production scenario and considerably more than that for the high output scenario.
Table 9: Value of Carbon Emissions from Higher California Oil Production
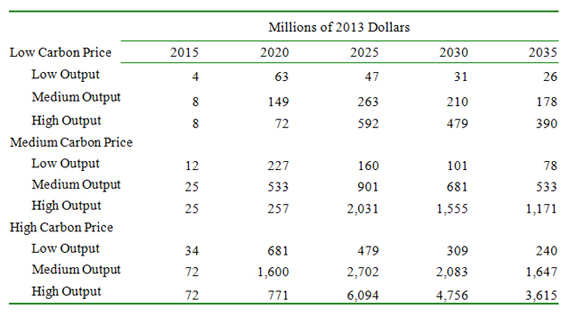
A similar set of calculations for carbon emissions associated with incremental natural gas production is undertaken. The study by Jaramillo (2007) provides estimates of the life cycle emissions of greenhouse gas emissions in the natural gas industry. Given the widespread concern about methane leaks during natural gas production, this study includes these emissions based upon a recent study by Allen et al. (2013).
The estimated values of these environmental impacts are summarized in Table 10 across the three carbon price and production scenarios. Given the smaller volume of natural gas production relative to oil, the environmental costs are considerably smaller than those estimated for crude oil production. Environmental impacts range from $4 million to $592 million under the low carbon price scenario. The medium output and carbon price scenarios have environmental impacts from natural gas production increasing from $25 million in 2015 to slightly more than $900 million in 2025 before tracking down to $533 million in 2035 (see Table 10). The high carbon price and high production scenario has environmental impacts from higher gas production starting at $72 million in 2015, peaking at over $6 billion in 2025 and then declining with production to $3.6 billion in 2035. Overall, while significant, these environmental impacts are considerably smaller than those associated with crude oil production.
Table 10: Value of Carbon Emissions from Higher California Gas Production
5.2 Oil Spills
Another significant concern with expanding oil production in California involves oil spills. In fact, the present-day moratorium on offshore drilling off the eastern and western coasts of the United States originates with the 1968 well blowout off the Santa Barbara coast. This policy has become a fixture of U.S. energy policy despite the likelihood of billions of barrels of recoverable oil under continental coastal waters.
Unlike the environmental impacts from additional oil and natural gas consumption, the environmental impacts of oil spills are inherently probabilistic in nature. In other words, they can occur but with low frequency. The environmental impacts, therefore, should be viewed in a probabilistic context. The best measure of occurrence of oil spills in this situation is the expected value or the most likely outcome given the distribution of possible outcomes.
Using records of actual oil spills Anderson et al. (2012) find that 32,329 barrels of oil are spilled for every billion barrels produced. Harper et al. (1995) find that offshore and onshore costs of cleanup are between $30 thousand and $107 thousand dollars per barrel spilled. Using these values for the three production scenarios provides estimates of the expected value of oil spill costs from higher oil production offshore California.
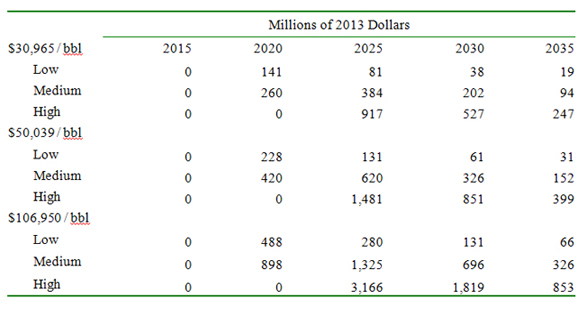
The results appear in Table 11. Compared with the other environmental impacts, the expected value of the environmental impacts from oil spills is small due to their relatively low frequency and size. For example, in the peak year of production in 2025 across all three offshore scenarios, the expected environmental damages range from $81 million to $3.166 billion (see Table 11). The latter is considerably smaller than the comparable estimates of $53.26 billion and $6.094 billion for environmental impacts from greenhouse gas emissions for oil and gas respectively. Nevertheless, oil spills are serious problems and these estimates provide a basis for establishing a contingency fund to mitigate their impacts if additional offshore production was allowed.
Table 11: Value of Expected Oil Spill Costs from Higher California Oil Production
5.3 Impacts on Land and Water
There are additional environmental impacts that would arise primarily from developing the Monterey Shale. Hydraulic fracturing uses large volumes of water to liberate oil and natural gas from tight rock formations, such as the Monterey Shale. Handling these large volumes of water inevitably involves spills on land or in local waterways. In addition, there are environmental impacts that arise from well blowouts, which occur in less than one percent of wells drilled, see Considine (2013). Environmental contamination also occurs when there are defects in the construction of wells that allows methane and flow-back water to enter local aquifers. Like well blowouts, these events occur with low frequency, see Considine (2013). This study uses the findings reported by Considine et al. (2013) to measure the frequency of these events and by Considine et al. (2011) to estimate the value of the associated environmental impacts.
The estimates reported in Table 12 include the value of air, land, and water impacts from diesel use during hydraulic fracturing, impacts from blowouts and other accidents, and the impacts from water contamination from well bore failures. Like the oil spill estimates above, these estimates should be viewed as expected values. As Table 12 illustrates, these values range from $108 to $349 thousand per well. These values use the value of water damages implicit in the Dimock case in Pennsylvania discussed by Considne et al. (2011). Multiplying these values by the number of wells drilled yields the total expected value of these environmental impacts under the three production scenarios for onshore development of the Monterey Shale. As the table illustrates, the expected values range from $10 to $387 million.
Table 12: Expected Value of Other Environmental Impacts

5.4 Total Environmental Impacts
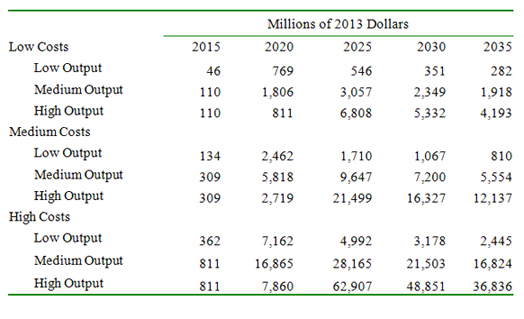
The total environmental impacts – greenhouse gas emissions from oil and gas production and consumption, oil spills, and other environmental impacts, such as well blowouts and water contamination – are summarized below in Table 13. With relatively low prices for carbon emissions, oil spill costs, and water damage assessments, the total value of environmental impacts range from $46 million to $6.8 billion. The medium cost scenario in the second panel in Table 13 has vales ranging from $134 million to $21.5 billion. Finally, in the high cost scenario the three production scenarios generate environmental impacts that range in value from $362 million to $62.9 billion.
Table 13: Total Expected Value of Environmental Impacts
* * *
6. CONCLUSION
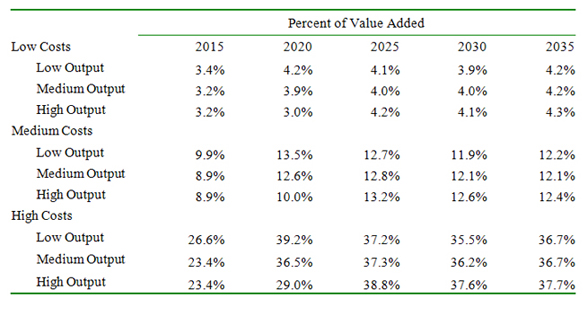
The resource and economic impact assessment conducted above finds significant economic benefits from developing California’s oil and natural gas resources. These developments, however, entail environmental impacts, which the previous section estimated. The key question is how the economic benefits compare with the value of the environmental impacts. To address this question, Table 14 presents the value of environmental impacts as a percent of value added from additional oil and gas production in California. With low environmental resource costs, the estimated values for environmental impacts are roughly 4 percent of value added. Under the medium cost scenario, the percentage rises to between 9 and 12 percent. Incidentally, most royalty rates are around 12 percent, suggesting that some form of taxation in that range could be used to endow environmental contingency funds. The high cost scenario has environmental impacts between 23 and 38 percent of value added. Overall, these findings suggest that the economic benefits from developing California’s oil and natural gas resources substantially exceed the value of the associated environmental impacts.
Table 14: Environmental Impacts as a Percent of Value Added
The above analysis demonstrates that California citizens pay a rather steep price in terms of foregone opportunities from restricting access to oil and gas development. In other words, the strategy of leaving the resources in the ground passes up billions in value added and tax revenues at the cost of avoiding environmental impacts that are worth far less. Even under the worst-case scenario with high carbon prices and environmental damage cost assessments, the “leave-it-in-the-ground” strategy foregoes $2.5 in economic gains for every dollar of avoided environmental impact. Under the medium environmental cost scenario, the ratio is close to ten-to-one. The implication is that if California is willing to pay for these environmental impacts, the returns would be significant in terms of employment, value added, and tax revenues.
* * *
Appendix A: Analysis of Supply and Demand Adjustments
Consider the equilibrium condition for the crude oil or natural gas market:

where Qd is the total demand for crude oil or natural gas, Qo is production of crude oil or natural gas from California, and Qc is crude oil or natural gas supply from other regions.
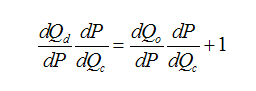
Recognizing that each quantity in (1) is a function of price, taking the total differential of (1) and re-arranging terms yields:
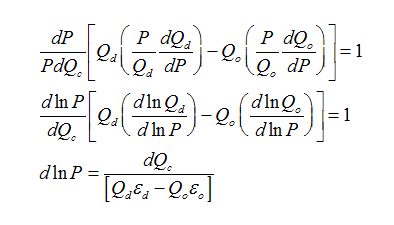
Factoring equation (2) and transforming to express in terms of elasticities provides:
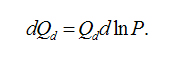
where is the elasticity of total market demand and is the elasticity of supply from other regions. The change in incremental demand is given by:
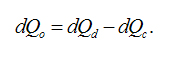
The change in production from other regions can be computed as follows:
The elasticities of supply and demand for natural gas and crude oil are determined based upon a review of the literature. The crude oil supply elasticity is 0.58 based upon a survey conducted by Dahl and Dugan (1996). The elasticity of crude oil demand is -0.58, which is an average of long-run price elasticities of demand reported by Hamilton (2009). The natural gas price elasticity of demand is -0.236, which is a sector weighted average of demand elasticities estimated following the model specifications developed by Considine et al. (2011b). The natural gas supply elasticity is 0.345, which is computed based upon a comparison of simulations from the National Energy Modeling System developed by the Energy Information Administration described by Considine (2013).
As an illustration of these calculations, consider the high production scenario for California crude oil. The base world oil consumption forecast is from the Annual Energy Outlook for 2013. Demand for oil outside California is determined by subtracting base California oil production assuming a 3 percent depletion rate plus the incremental change for each scenario from total world consumption projected by EIA. The percentage change in demand is computed using equations (4). Production outside California is computed using equation (5).
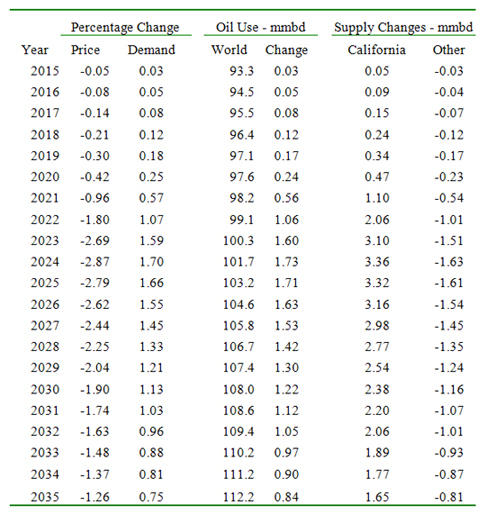
An example of the results appear below in Table A1 indicating that the 3.3 million barrels of additional oil production in 2025 under the high production scenario would reduce world prices by 2.79 percent, which would increase world consumption by 1.7 million barrels per day and reduce production outside California by 1.6 million barrels per day.
Table A1: Oil Market Adjustments to California High Production Scenario
* * *
REFERENCES
Allen, David, V.M Torres, J. Thomas, D. Sullican, M. Harrison, A. Hendler, S. Herndon, C. Kolb, M. Fraser, A. Hill, B. Lamb (2013) “Measurements of Methane Emissions at Natural Gas Production Sites in the United States,” Proceedings of the National Academies of Science, 110. 44, 17768-17773, http://www.pnas.org/content/110/44/17768.
Anderson C., M. Mayes, and R. LaBelle (2012) “Update of Occurrence rates for Offshore Oil Spills,” U.S. Department of Interior, Bureau of Ocean Energy Management, http://www.boem.gov/uploadedFiles/BOEM/Environmental_Stewardship/Environmental_Assessment/Oil_Spill_Modeling/AndersonMayesLabelle2012.pdf.
Avalos, A. and D. Vera (2013) “The Petroleum Industry and the Monterey Shale: Current Economic Impact and the Economic Future of the San Joaquin Valley,” California State University, Western State Petroleum Association, http://www.wspa.org/sites/default/files/uploads/The%20Petroleum%20Industry%20and%20the%20Monterey%20Shale%20-%20Fresno%20State%20Study.pdf, 38 pages.
Considine. T.J., R. Watson, N. Considine, and J. Martin (2013) “Environmental Regulation and Compliance in Marcellus Shale Gas Drilling,” Environmental Geosciences, 20, 1, 1-16.
Considine, T.J. R. Watson, and N. Considine, (2011a) “The Economic Opportunities of Shale Energy Development,” The Manhattan Institute, June 2011, http://www.manhattan-institute.org/pdf/eper_09.pdf, 28 pages.
Considine, T.J., R. Watson, and S. Blumsack (2011b) “The Economic Impacts of the Pennsylvania Marcellus Shale Natural Gas Play: An Update,” Energy and Mineral Engineering, May 2010, 59 pages,
Considine, T.J. (2013) “Powder River Basin Coal: Powering America,” Natural Resources, 4, 8 (2013), 514-533.
Dahl, C. and T. Duggan (1996) “U.S. Energy Product Supply Elasticities: A Survey and Application to the U.S. Oil Market,” Resource and Energy Economics, Vol. 18, No. 3, 243-263.
Humphries, M. and R. Pirog (2012) “U.S. Offshore Oil and Gas Resources: Prospects and Processes,” Congressional Research Service, http://assets.opencrs.com/rpts/R40645_20120210.pdf, 31 pages.
Gordon, P., J. Park, A. Khodabakshnejad, K. Hopkins, D. Wei, and A, Rose (2013) “Economic Modeling Scenarios,” Appendix K, “The Monterey Shale & California’s Economic Future,” University of Southern California, http://gen.usc.edu/assets/001/84955.pdf, pages 62-68.
Hamilton, James (2009) “Understanding Crude Oil Prices,” The Energy Journal, International Association for Energy Economics, vol. 30, No. 2, pages 179-206.
Harper, J. A. Godon, and A. Allen (1995) “Costs Associated with the Cleanup of Marine Oil Spills,” http://ioscproceedings.org/doi/pdf/10.7901/2169-3358-1995-1-27.
Hughes, J. D. (2013) “Drilling California: A Reality Check on the Monterey Shale,” Post Carbon Institute, http://www.postcarbon.org/report/1977481-drilling-california-a-reality-check-on, 49 pages.
Interagency Working Group on Social Cost of Carbon (2013) “United States Government Technical Support Document: Technical Update of the Social Cost of Carbon for Regulatory Impact Analysis – Under Executive Order 12866, https://selectra.co.uk/sites/default/files/pdf/cost%20of%20carbon.pdf
Jaramillo, Paulina (2007) “A Life Cycle Comparison of Coal and Natural Gas for Electricity Generation and the Production of Transportation Fuels, “ Ph.D. Dissertation, Carnegie Mellon University.
Minnesota IMPLAN Group (2011) .
Park, J. and P. Gordon (2013) “Macroeconomic Impacts of Developing the Monterey Shale Using Advanced Extraction Technology,” Chapter 3 in, “The Monterey Shale & California’s Economic Future,” University of Southern California, http://gen.usc.edu/assets/001/84955.pdf, pages 25-40.
Schniepp, M. ( 2009) “Economic Benefits of Future Oil and Gas Production in Santa Barbara County,” California Economic Forecast, Santa Barbara Industrial Association Economic Conference, Santa Barbara, California.
U.S. Energy Information Administration (2011) “Review of Emerging Resources: U.S. Shale Gas and Shale Oil Plays,” http://www.eia.gov/analysis/studies/usshalegas/ pdf/usshaleplays.pdf, 82 pages.
U.S. Energy Information Administration (2013) “Annual Energy Outlook for 2013,” http://www.eia.gov/forecasts/aeo/pdf/0383(2013).pdf.
* * *
About the Author: Dr. Timothy Considine is a School of Energy Resources Professor of Economics in the Department of Economics and Finance at the University of Wyoming. He received his Ph.D. from Cornell University. His research on petroleum market analysis has been published in the top economics journals. Recently, The Cato Institute published his paper exploring management policy issues facing the U.S. Strategic Petroleum Reserve, and the U.S. Department of Energy’s Office of the Strategic Petroleum Reserve currently uses his econometric model of world crude oil markets to estimate the market impacts of various management policies. Dr. Considine also worked as an economist at Bank of America, and as the lead analyst for natural gas deregulation on the U.S. Congressional Budget Office.