
Rates of Pay and Pension Debt in California’s Distressed Cities
Nobody needs reminding that California’s cities, like every other going concern in America, are heading for tough economic times. As recently as two months ago, robust collections of sales taxes, utility taxes, transient occupancy taxes, property taxes and other sources of taxes and fees were pouring money into municipal coffers. Now, with the economy abruptly ground to a near standstill, these revenues are all but dried up. But municipal expenses haven’t dropped proportionately, if at all.
What bears reminding is the fact that even before the sudden pandemic shutdown, California’s cities were in financial trouble. Just six months ago – and it seems like a century has passed – the California state auditor released a fiscal health analysis of California’s cities. Measuring factors including cash liquidity, debt burden, financial reserves, revenue trends, and retirement obligations, the report ranked the cities from the healthiest to the most afflicted.
During the economic downturns already endured by California cities in this century, public sector pay and benefits continued to increase even as the private sector workforce experienced layoffs and pay cuts. In the aftermath of the tech bubble bursting, pension benefit enhancements continued to gain approval by cities, one by one, justified by the reasoning that if a neighboring city had done so, then every city must follow suit. In the aftermath of the real estate bubble bursting, city workers took furloughs, where they worked one day less per week and received 20 percent lower pay – but their rate of pay did not decline.
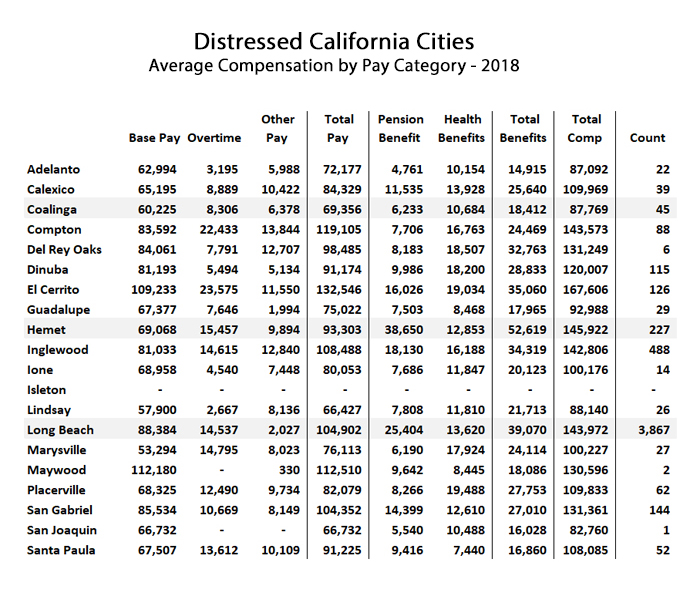
The data presented here, calculated based on data posted on the State Controller’s website, discloses average pay for twenty California cities, all of them within the worst 50 in terms of financial health according to the state auditor. The first chart, below, shows average pay for full time workers. Only five of these cities, Adelanto, Coalinga, Guadalupe, Lindsay, and San Joaquin, show average total compensation under $100,000 per year. By the way, to identify an individual pay record as for a full time worker, the criteria was that the base pay would exceed a minimum of $30,000 and be in excess of the minimum pay reported for that position, and that the individual received health and pension benefits. On that basis, tiny Isleton had zero employees in 2018.
On the chart below there are three cities, Coalinga, Hemet, and Long Beach, which are shaded. The shading indicates these cities DID include the “unfunded contribution” in their total pension benefit expenses per employee. Most cities do not report this cost as part of individual compensation, despite it being a huge expense. This is an important distinction, because the unfunded payments are almost invariably larger than the normal pension payments. That can be seen in the fact that the average individual pension cost for Hemet, $38,650, and for Long Beach, $25,404, greatly exceed the amounts calculated for the other cities. Coalinga, with a relatively small individual pension payment despite including their unfunded payment in the average, is a rare exception. A review of Coalinga’s active employees shows that all of them have post-PEPRA (the 2014 legislative pension reform) benefit formulas, and a review of their Transparent California retiree pensions shows modest retiree benefits. But Coalinga, to put it mildly, is an outlier.
Tough Times Call for Fiscal Restraint
The point of showing this pay and benefits information is not meant to overemphasize how much some city employees make, but rather to provide information that may help convince elected officials and voters that further pay increases should not be considered at this time. The City of Huntington Beach recently approved pay increases for some of their employees, despite knowing the city faces potentially catastrophic shortfalls in revenue in the coming months. There are rumors that the City of San Diego is negotiating possible pay increases. Across the state, cities face the decision to continue issuing cost-of-living increases, step increases, or even negotiating new increases to pay and benefits. But these are not ordinary times. At the least, all forms of compensation should be frozen.
What is often forgotten when discussing issues of public employee compensation is how easy it is to underestimate the accurate averages. Three concepts need to be reiterated.
First, in the public sector, median compensation is almost always higher than average compensation. This is never the case in the private sector, where a handful of very wealthy individuals invariably pull the averages up. Therefore, when we compare median household income to average total public employee compensation, we understate the disparity. (Nerdflash: When Excel comes up with an “=medianifs” function, we’ll prove this!)
Second, many calculations of average income in the public sector include part-time workers, just as many calculations of average pensions in the public sector include retirees who only worked a few years and consequently received a relatively modest pension benefit. The averages presented here are only for full time employees, which is far more representative of how much they make.
Third, total compensation must be considered as the only legitimate measurement of how much anyone makes. While “base pay” may or may not seem low, there is “other pay,” comprised of literally dozens of pay categories including car allowances, meeting stipends, longevity pay, incentive pay, and bonus pay. Similarly, the cost to the employer for pension benefits and health insurance must be counted as pay – doesn’t a self employed person have to set aside money out of their earnings to pay for those benefits?
Here then are snapshots of total compensation for five cities, chosen from among the twenty listed above based on their larger employee headcounts.
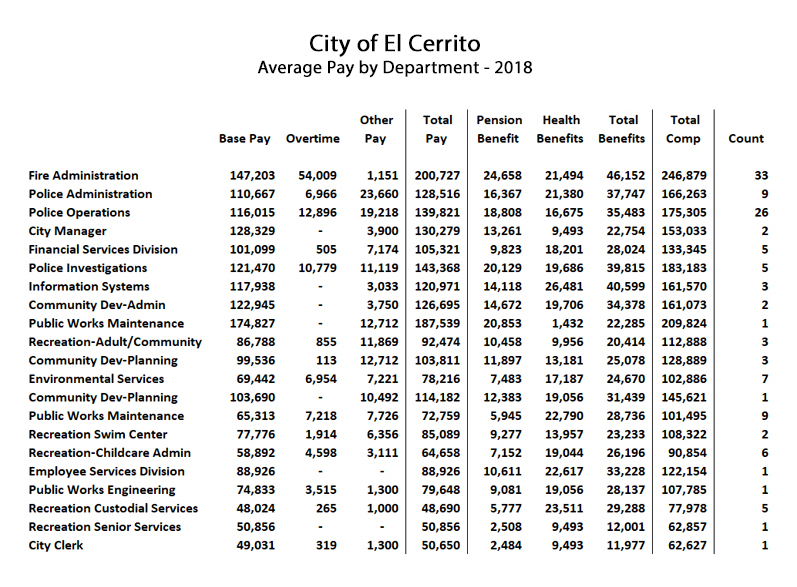
The first of these snapshots depict average pay by department for the City of El Cerrito. The first thing that jumps out of the data for this financially troubled city is that their average full time firefighter made an astonishing $246,879 in pay and benefits during 2018. Why the police, who encounter risks that are arguably equivalent to firefighters, should be averaging total compensation of $175,305, only 71 percent as much, is a mystery. But the solution is not, as is so often the case, to increase police pay. The solution is to reduce firefighter pay.
Something else important to note is that El Cerrito, along with most of the cities considered here, does NOT report as part of its individual employer paid pension benefit, any amounts to pay down their unfunded liability. As previously noted, this grossly understates how much their employees really make.
The estimated median household income for a resident of El Cerrito in 2017 was $104,455, compared to an average total compensation for El Cerrito’s full time city workers in 2018 of $167,606. Despite entire households (presumably with, on average, more than one worker per household) making only 62 percent of what the average city worker makes in El Cerrito, that’s among the closest ratios you’re likely to see.
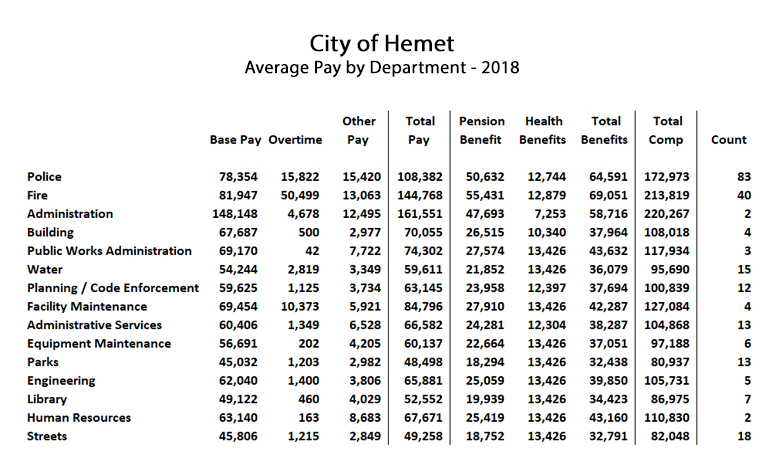
Viewing the total compensation by department data for Hemet, below, offers insights into why pension costs are sinking California cities. Remember, this is 2018 data. Back in 2018, pension contributions were calibrated by CalPERS based on actuarial estimates that were only updated through 6/30/2016, because the pension actuaries always submit their formal estimates one year after financial reports are issued. That is, a typical city’s consolidated annual financial report (CAFR) for the fiscal year ended 6/30/2017 would only show pension liability estimates as of 6/30/2016. Yeah. They’re that far behind.
In any case, look at the average employer pension cost for Hemet’s police, $50,632, when base pay for police only averages $78,354. For their firefighters, the average employer pension contribution is even more, $55,431, when base pay averages $81,947. These cities were on track, before the pandemic shut down the economy, to be paying nearly as much in pension fund contributions as they were for base pay.
The median household income in Hemet in 2017 was 39,801; the average full time worker in 2018 made total compensation of $145,922. That’s 3.7 times as much.
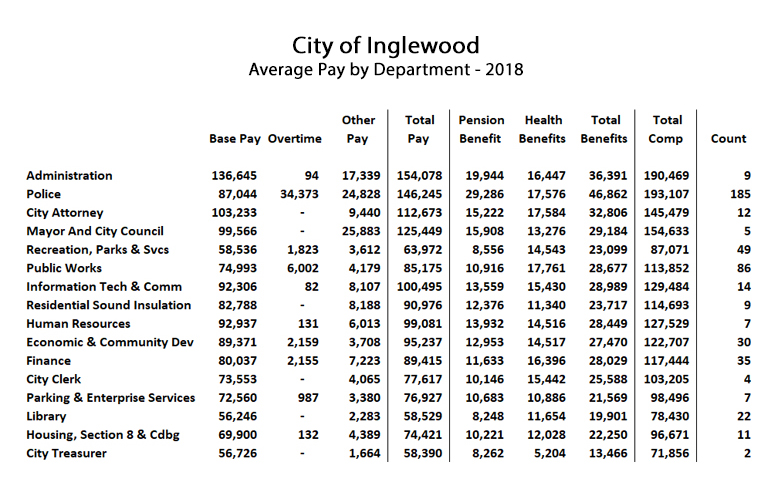
The next city, Inglewood, offered in 2018 an average overall total compensation package for its full time employees of $142,806, as depicted in the first chart. And as seen below, their lowest paid employees are the two members of their treasury department – likely clerical positions – at $71,856, and then their Section 8 housing department, where the 22 full time members of that department earned on average $78,430 during 2018. Inglewood had an estimated median household income in 2017 of $51,456.
Let that sink in. The average total compensation of a full time employee with the City of Inglewood is 2.8 times higher than the median household income for a private sector resident of that city. Yes, household income calculations don’t necessarily include the value of benefits. But private sector benefits rarely exceed 25 percent of pay, and “households” on average have more than one employed inhabitant.
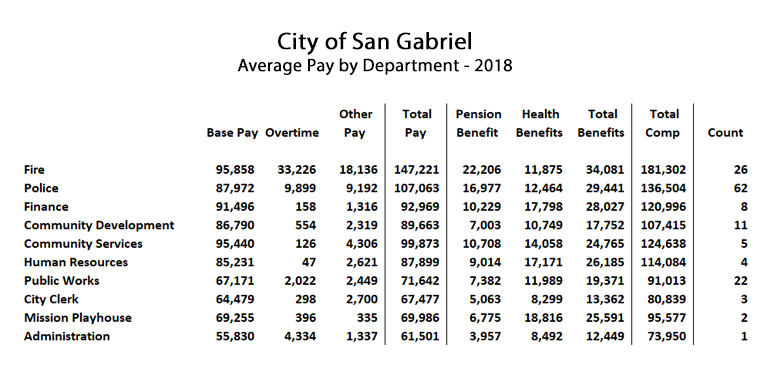
Continuing our random gallop through some of California’s financially distressed cities, the next chart shows the City of San Gabriel. The most remarkable thing about this data is that it is unremarkable. If the averages seem excessive, that’s typical. Overall, in fact, San Gabriel’s averages are a bit lower than what is found in most California cities. As usual, their firefighters are making far more than their police – why is this, when it is far harder to recruit police than to recruit firefighters?
And just to be clear: Pointing out this paradox is not to criticize firefighters. More generally, pointing out that public safety employees make a lot of money, and collect pensions we can’t afford, is not to criticize public safety employees. It is merely to make the difficult assertion, with respect, that the reason public safety employees make a lot of money is because sometimes they are on the front lines of bad things, like pandemics.
Freezing rates of public safety pay during a pandemic that paralyzes the economy, along with everyone else’s pay, is the appropriate thing to do. Their pay has always been higher because of the dangerous realities of their job. When the dangerous reality hits, you don’t raise their pay still more, because it has already been raised in anticipation.
The estimated median household income in 2017 for San Gabriel was $59,598. The average pay for a full time city worker in San Gabriel in 2018 was $131,361 (not including cost of unfunded pensions).
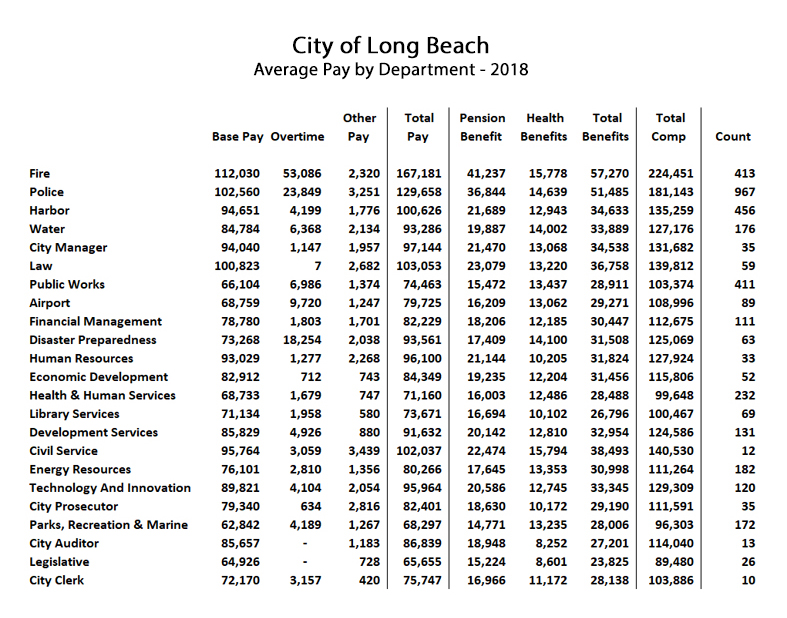
Which brings us to Long Beach. Why Long Beach? Sure, they’re among the top fifty distressed cities according to the state auditor’s report, but they didn’t make the top twenty. They’re not among the worst of the worst. Long Beach is a good example of a city that’s done a lot of things right, yet still finds itself estimated to be one of the most financially challenged cities in California. Why?
To really answer that, it is necessary to review not just the average pay for full time employees for the City of Long Beach, which was $143,972 in 2018, compared to an estimated median household income in 2017 of $60,557 – less than half as much. That’s a crippling payroll burden, just like it is in every other city in California. Why do members of the lowest paying department in the city earn, at $89,480 per year, 47 percent more than the average household in the city they serve? Why does the average full time firefighter in Long Beach earn nearly four times as much?
These are difficult questions. But if we can’t ask them now, when millions of Californians are unable to work at all, when can we ask them? What does public service mean in a democracy, if during hard times there isn’t shared sacrifice by the government employees, to help carry some of the burden and share some of the fate of the citizens being served?
It’s the Pensions, Stupid
Poor James Carville. His famous quote has made it all the way to the pension overhang, this abstruse albatross, this actuarial arcana, a nerd’s nemesis, ominous but opaque, the theoretical tsunami, the perennial phantom that never materializes, the metaphorical can kicked down the endless road for countless years. But it is. It is the pensions. And we are stupid to ignore them this time.
It was stupid to keep enhancing pensions back in 2001 through 2005 when the economy was digging out from the tech bubble crash and even the numerically challenged had belatedly realized that the stock market couldn’t consistently log returns like it had in the late 1990s. A few years after that, it was stupid for cities like Stockton and Vallejo to declare bankruptcy but leave the pension benefit formulas untouched. And it will be stupid, unforgivably stupid, to not recognize that this time, if defined benefits are to be saved, pension benefit formulas for all employees, for future work, need to descend to PEPRA levels.
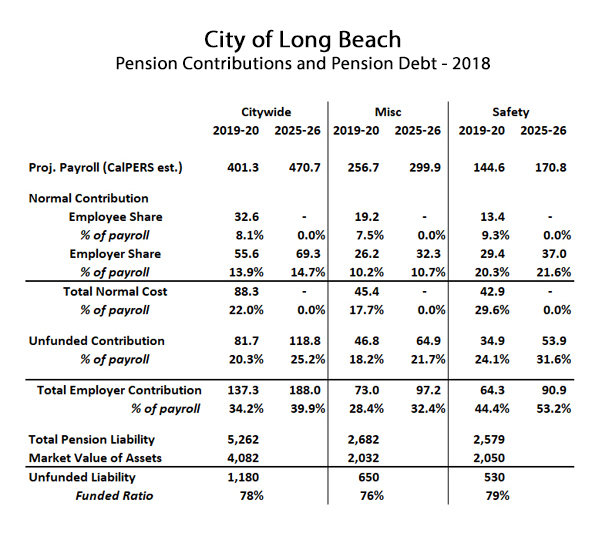
The final chart here depicts the cash flow impact of changing the earnings projections of a pension fund. There’s actually a lot to like here, so pay close attention. This is a good case, not a typical case. Note that the pension account, based upon most recent 6/30/2018 data (the 6/30/2019 CAFR) for the City of Long Beach was 78 percent funded. That’s a terrible ratio for any pension fund at the end of an eleven year bull market, but it’s nearly 10 percent better than the funded ratio at that time for CalPERS at large.
Observe the total estimated employer contribution in 2019-20, $137.3 million, compared to where it will go in five years – up to $188 million. That’s a 50 million bump they face, and these numbers came out before the pandemic slowdown. And Long Beach is a good case. Check these actuarial estimates for other California cities. In nearly every case, they’re worse. Much worse.
Over the coming months the California Policy Center will produce ongoing analysis of agencies – cities, counties, special districts – that are going to be severely stressed by the ongoing collapse of revenues, combined with the relentless rise in pension costs. But through all of what is to come, two responsible options present themselves. At the least, freeze all pay and benefits. And if possible, move all employees, regardless of hire date, to PEPRA level pension benefits for all future work, effective immediately.
If these two steps are taken, whatever financial challenges these cities face, and there will be many, will nonetheless be significantly easier to bear.
This article originally appeared on the website California Globe.