
A Method to Estimate the Pension Contribution and Pension Liability for Your City or County
July 24, 2013
Summary: With last week’s announcement that Detroit has declared bankruptcy, many wonder how their city, county, school district, or other government organization is doing. Citizens want their elected officials to behave responsibly so that what happened to Detroit won’t happen to them. But elected officials are not always cooperative when it comes to transparency. Politicians have been hiding from the consequences of their bad decisions on public employee pensions for years. By yielding to union pressure, they gave out pensions that were too generous in good times, covered budget shortfalls by failing to fund pensions in bad times, and now misrepresent how much taxpayers owe (called “unfunded liabilities”) to cover these mistakes by pretending that money already invested in their pension plan will earn more money than anyone can realistically expect.
To help keep elected officials accountable, the CPPC has developed a simple spreadsheet to calculate the unfunded liabilities and the required annual payments of the pension plans, using assumptions that make sense from the perspective of good government. We begin with a realistic rate of return on invested pension funds, which we borrowed from Moody’s: 5.7%. The average rate of return used by pension plans in this State is 7.2%. Second, once we adopt a more realistic rate of return, we can calculate a realistic unfunded liability and learn how much a pension plan really needs in new contributions each year. Responsible policy requires a responsible repayment plan of 20 years or less. Any plan that stretches longer will just cost taxpayers additional millions, or even billions, in interest.
The following tutorial and downloadable spreadsheet will empower the user to perform “what-if” analysis on the financial statements of public employee pension funds. To provide an example, the downloadable spreadsheet uses data that attempts to replicate the consolidated financial status of all of California’s public employee pension plans. The example uses the 5.7% Moody’s rate of return and a moderately accelerated payment plan, eliminating the unfunded liability over a 20 year period. Wherever possible, using assumptions and logic from Moody’s recent pronouncements on pensions – the spreadsheet calculates new estimates for California’s total estimated unfunded liability, normal required pension contribution, and “catch-up” contribution to reduce the unfunded liability.
When entering these values, using the sources and assumptions as described, the following changes to the financial condition of California’s public employee pensions would be indicated as of 6-30-2011:
All California Public Sector Pensions – Revalued Unfunded Liability:
– Officially reported unfunded liability = $158 billion.
– Revalued unfunded liability at 5.7% annual rate of return (discount rate) = $315 billion.
All California Public Sector Pensions – Revalued Annual Required Contribution:
– Officially reported total pension contributions (normal and catch-up) = $27.6 billion.
– Revalued total pension contributions (normal and catch-up) = $43.3 billion (based on an estimated normal contribution of $16.6 billion and a catch-up contribution of $26.7 billion).
This model can be used by anyone with basic financial knowledge and spreadsheet skills, in order to analyze and critique the official financial statements of any public employee pension fund.
* * *
INTRODUCTION
The financial challenges facing public sector pensions now receive regular press coverage. These press reports quote various financial statistics relating to pensions, citing as their sources the official pronouncements and financial statements from the pension funds, or citing independent studies. Almost always missing from this dialogue, however, are attempts to provide quantitative tools to journalists, policymakers, activists and researchers to allow them to personally analyze pension data.
The purpose of this study is provide a downloadable spreadsheet that will accept various assumptions in order to estimate three things, (1) the amount of the unfunded liability (or surplus), (2) the amount of the annual so-called “normal contribution” that pays for future pension benefits that are earned in any given year, (3) the amount of the annual “catch-up” contribution due to the pension fund in order to restore full funding.
With this spreadsheet, the user may evaluate the official data provided by the pension funds for any participant group – including an entire state, or any given city or county – and come up with a variety of estimates based on changing key assumptions. The user can then compare these estimates to the officially reported amounts for any pension fund’s unfunded liability as well as for its required annual catch-up and normal contribution.
This model is not designed nor meant to replace a thorough financial analysis by a certified actuary or certified public accountant and is intended for educational purposes only.
The remainder of this study is a tutorial that attempts to (1) explain the concepts of pension unfunded liabilities, normal pension contributions, and catch-up pension contributions, and (2) explain how to use the downloadable spreadsheet to allow the user to make independent estimates of these amounts using various assumptions. This study assumes the reader has some background in accounting or finance, as well as basic spreadsheet skills. As footnoted wherever applicable, most assumptions used in the examples presented are drawn from Moody’s “Revised New Approach to Adjusting Reported State and Local Government Pension Data,” released in April 2013. .
* * *
PENSIONS: KEY REPORTING VARIABLES
Unfunded Liability = The Value of Invested Pension Fund Assets minus the present value of all future liabilities to pay pensions. If the result is less than zero, the pension plan is said to be underfunded.
Unfunded Contribution = The annual catch-up payment to the pension fund necessary to restore the plan to full funding.
Normal Contribution = The annual payment to the pension fund necessary to match the present value of future pension benefits earned in the current year to invested assets.
* * *
If you would like to perform what-if analysis, using the financial statements provided by any public pension fund, before reading this tutorial, please download the spreadsheet:
Impact-of-Returns-and-Amortization-Assumptions-on-Pension-Contributions.xlsx
HOW TO ESTIMATE THE UNFUNDED PENSION LIABILITY USING VARIOUS ASSUMPTIONS
For this analysis, please refer to the spreadsheet’s “unfunded liability and payment” tab.
Table 1 below is a screen shot of the “unfunded liability and payment” tab from the spreadsheet. The first two rows of data immediately under the title “OFFICIALLY REPORTED NUMBERS” show the two key variables that determine the amount of an unfunded pension liability; (1) the present value of the total future pension liability less (2) the total assets currently held by the fund. The cells in yellow are input cells where assumptions are entered.
The data being used in all of the examples to follow is taken from the California State Controller’s “Public Retirement Systems Annual Report for the fiscal year ended June 30, 2011,” which was released on May 22, 2013 and is the most recent data available on the consolidated performance of all of California’s public employee pension funds combined .
As can be seen in the yellow input cells, the present value of all future pension payment obligations to all participants in California’s public employee pension funds was officially estimated as of 6-30-2011 to be $763 billion. Since the officially reported combined assets of all of California’s public employee pension funds was $604 billion, the officially recognized total unfunded pension liability was $158 billion.
The second half of the spreadsheet shown in Table 1, titled “REVALUATION OF UNFUNDED PENSION LIABILITY,” allows the user to revise the estimate of the unfunded pension liability using methods described by Moody’s in their “Revised New Approach to Adjusting Reported State and Local Government Pension Data.” While the logic used by the spreadsheet is a shortcut that cannot replace a comprehensive actuarial update, it utilizes the same logic employed by Moody’s credit analysts and can be quite useful. Here’s how it works:
The variable that is the hardest to estimate is not the assets in a pension fund, which have a current market value that is fairly objective, but the present value of the future liabilities. Rather than perform an actuarial analyses that encompasses every estimated annual payment for every year of every participating employee’s current or eventual retirement, and applying a discount rate to each of these literally millions of data points in order to come up with a new present value for these future liabilities, Moody’s assumes that the “future value” of these payments over time has a midpoint of 13 years. A somewhat simplified way to explain the choice of 13 years would be because the average duration of retirements already earned within the participant population is estimated at 26 years, as a result 13 years is the midpoint. Here is how Moody’s explains their methodology to revalue an unfunded pension liability, including the rationale for their choice of 13 years :
“To implement the discount rate adjustment, we propose using a common 13-year duration estimate for all plans. This is a measure of the time-weighted average life of benefit payments. Each plan’s reported actuarial accrued liability (“AAL”) is projected forward for 13 years at the plan’s reported discount rate, and then discounted back at 5.5%. This calculation results in an increase in AAL , of roughly 13% for each one percentage point difference between 5.5% and the plan’s discount rate.”
TABLE 1 – RECALCULATING THE UNFUNDED PENSION LIABILITY
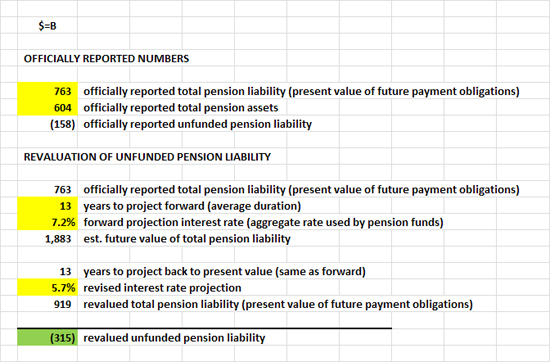
As Table 1 hopefully illustrates, in order to estimate the impact of a lower discount rate on a pension plan’s unfunded liability, you enter the officially reported total pension liability and total pension assets into the first two yellow input cells. The spreadsheet automatically calculates the official unfunded liability. To then revalue the total pension liability, using the yellow input cells, first enter, in years, the assumed midpoint of the future payment streams (“years to project forward”), then enter the official rate of annual investment return projected by the pension fund (“forward projection interest rate”). In the case of California’s consolidated pension funds, the average official annual return is 7.2% . The spreadsheet then calculates the future value of these payment obligations. To get a revised present value using a lower rate of return, just enter the revised interest rate projection. Moody’s has recommended the “Citibank Pension Liability Index (Index) posted as of the date of the pension financial statements being analyzed, which for 6-30-2011 was 5.7% .
As shown in the green results cell on Table 1, using this tool, if California’s pension funds, in aggregate, were using a 5.7% annual rate of return projection, instead of a 7.2% return projection, their official unfunded pension liability would swell from $158 billion to $315 billion. This spreadsheet can be used to estimate the unfunded pension liability based on a more conservative rate of return for any public sector pension fund.
* * *
HOW TO ESTIMATE THE ANNUAL “CATCH-UP” CONTRIBUTION
For this analysis, please refer to lower section of the spreadsheet’s “unfunded liability and payment” tab.
Explaining the various methodologies currently employed to estimate the annual catch-up contribution goes beyond the scope of this study. What will be striking however is the disparity between the catch-up payments necessary according to the spreadsheet – which again emulates the new Moody’s evaluation criteria – and the actual catch-up payments being collected from participating employers by most public sector pension plans.
The first step towards estimating the catch-up payment is to determine the amount of the unfunded pension liability, since that is the balance that will need to be reduced to zero over a reasonable period of time. But even if you calculate the catch-up payment using the officially recognized amount for the unfunded pension liability, you may find the required payment is still much higher than is being paid into the plan you are analyzing. This is because many of pension funds are estimating the required payments using terms that are longer than the 20 years recommended by Moody’s , and they are also – quite often – using a graduated payment plan that has very low payments in the early years of the term. In many cases the officially agreed catch-up payments are so low that they cause negative amortization. Moody’s recommends a 20 year, level payment plan based on an interest rate of 5.7% .
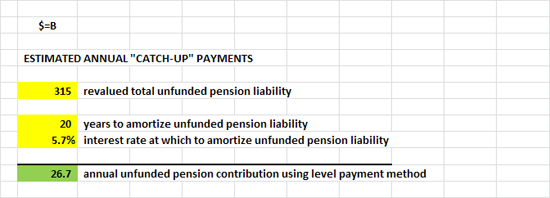
Table 2, below, shows how the spreadsheet calculates the annual catch-up contribution. Refer to the rows immediately under the title “ESTIMATED ANNUAL ‘CATCH-UP’ PAYMENTS.” The revalued total unfunded pension liability for all of California’s pension funds, $315 billion, is entered in the first yellow input cell “revalued total unfunded pension liability.” The term, 20 years, and the interest rate, 5.7%, are entered in the next two yellow input cells. The spreadsheet calculates even payments on a 20 year fixed rate, fixed payment amortization of the principle.
As can be seen in the green results cell, based on these assumptions, the annual catch-up payments required to restore California’s public employee pensions to 100% funding status is $26.7 billion per year.
TABLE 2 – ESTIMATING THE ANNUAL PAYMENTS ON THE UNFUNDED LIABILITY
* * *
HOW TO ESTIMATE THE NORMAL CONTRIBUTION
To properly use the spreadsheet to estimate the normal contribution, it is important to understand the concept. The “normal contribution,” simply stated, needs to be an amount equal to the present value of future pension payment obligations earned in the current year. This is distinct from the unfunded liability, is calculated by comparing the present value of previously earned pension benefits (prior to the current year’s pension benefit earnings) to the assets on hand (prior to the normal contribution).
Revaluing the Normal Contribution if the Official Normal Contribution is Disclosed:
For this analysis, please refer to the spreadsheet’s “normal contribution (known)” tab.
If the financial statements for the pension fund under analysis disclose how much they collected in normal contributions during the fiscal year, then revaluing the required normal contribution using differing assumptions is relatively easy. Since the normal contribution must be exactly the same amount as the present value of the future liabilities created during the most recent fiscal year – by employee participants accruing one more year of pension benefits – if you know the amount of the contribution, by definition you also know the estimated new future liability.
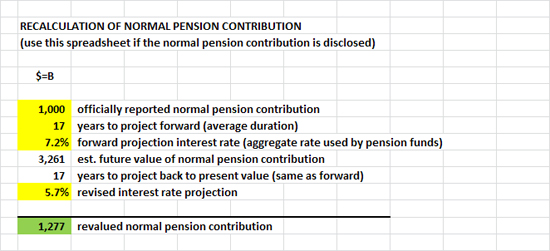
Table 3, below, shows this calculation on the spreadsheet. Using the exact same logic as the 2nd half of the spreadsheet segment depicted on Table 1, the first step is to enter in the first yellow input cell the amount of the “officially reported normal contribution.” In the example below, $1,000 is used to normalize the results – it is not possible to use numbers representative of all of California’s pension plans because the State Controller’s report did not provide that breakout.
The next step is to enter the “years to project forward,” with 17 entered in the example because this is the number Moody’s determined was the most likely average “active employee duration.” Here is how Moody’s describes this :
“The 17-year duration assumption reflects our estimate of the average remaining service life of employees based on a sample of public pension plans. We acknowledge that this is a simplifying assumption that may be too long or too short for different plans.”
In order to complete the recalculation, enter the official interest rate used by the pension fund, which in this case is the average rate used by all of California’s pension funds, 7.2% , then enter the “revised interest rate projection” as recommended by Moody’s .
The spreadsheet result in the green cell shows that using lower interest rate assumptions, the required normal contributions have to be increased by 27.7%.
TABLE 3 – NORMAL PENSION CONTRIBUTIONS (OFFICIAL AMOUNT DISCLOSED)
Revaluing the Normal Contribution if the Official Normal Contribution is NOT Disclosed:
For this analysis, please refer to the spreadsheet’s “normal contribution (imputed)” tab.
Table 4, below, offers a method to estimate the required normal contribution in cases where the pension fund’s financial statements only provide one number for their “annual contributions,” instead of breaking that number into two: “Normal contributions,” and “Catch-up contributions.” The California State Controller, for example, in their “Public Retirement Systems Annual Report for the fiscal year ended June 30, 2011,” discloses total pension fund contributions for the year of $27.6 billion , but do not disclose how much was for the normal contribution and how much was “catch-up” payments on the unfunded liability.
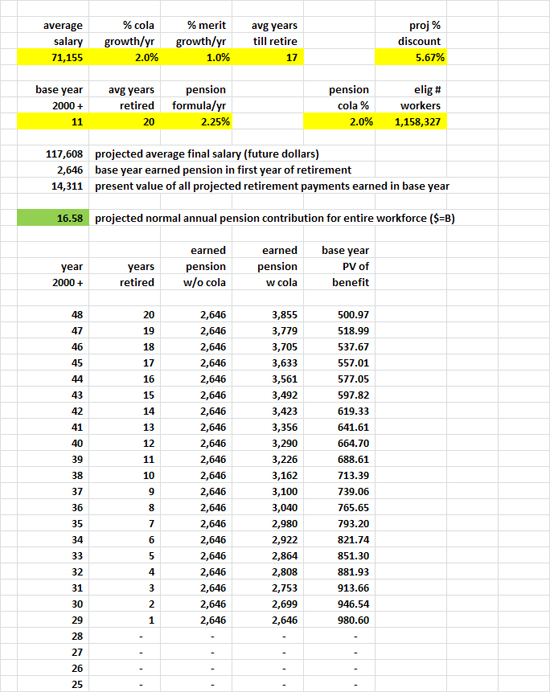
In order to estimate the required normal contribution, the spreadsheet gathers information for one hypothetical employee whose earnings and other actuarial data are representative of the average employee in the participating population, then multiplies the results by the number of participants. While this is a gross simplification, and, unlike the other calculations described so far, does not emulate a methodology recommended by Moody’s, it yields surprisingly accurate results.
In the example on Table 4, most of the assumptions entered in the yellow input cells are documented, others are selected based on reasonable estimates of what averages probably are for the overall population of actively employed public pension plan participants in California.
For example, according to the U.S. Census Bureau, the average salary in 2011 for a full-time state or local worker in California in FYE 6-30-2011 was $71,155, and in that same year there were 1,158,327 full-time state and local government workers in California . The average years till retirement, 17 years, is based on estimates from Moody’s as previously discussed , as is the projected discount rate of 5.67% .
For the remaining variables, we have tried to use conservative assumptions that will understate the resulting estimate. The % COLA growth per year, along with the % merit growth per year, totaling 3%, represents the before-inflation average increase in pension eligible pay during the working years of a typical participant (probably low when the so-called “step increases” are taken into account); the “pension COLA” of 2.0% represents the average cost-of-living increases to the pension benefit during a typical participant’s retirement. The “average years retired,” 20, is almost certainly lower than the true number, as is the “pension formula/yr” of 2.25%.
By examining the three calculations on Table 4 – the three rows of numbers and descriptions situated below the yellow input cells and above the final green results cell, one may gain insight into how pension benefits accrue each year.
First, the spreadsheet calculates the amount that the participant will collect per year during retirement, based on their work in the current year. It does this by calculating how much their average salary ($71,155 in this example) will increase between the current year and retirement in 20 years (71,155 x 1.03)^20 = $117,608.
Second, the “projected average final salary” is multiplied by the “pension formula/yr” of 2.25%. The product, $2,646, appears next, described as “base year earned pension in first year of retirement.”
It is important to reiterate that the “normal” required annual pension contribution is only to fund the amount of future pension earned by one year of working, which is why the amounts appearing in this representative sample are so small. In this example, in one year working, the average state or local government employee in California earns a lifetime income of $2,646 per year. Over the next 20 years that amount escalates via the 2.0% COLA to become $3,885 in the final year of retirement.
To understand the 3rd calculation, “present value of all projected retirement payments earned in base year,” it is necessary to review the two columns of results on the far right of the lower section of the spreadsheet, titled “earned pension w COLA” and “base year PV of benefit.” The earned pension with COLA is denominated in future dollars. As described already, it starts at $2,646 per year and grows via the COLA’s to $3,855 per year. The column immediately to the right then converts those future dollars into current (today’s) dollars using the projected discount rate of 5.67%. For each cell in this column, a simple present value formula is applied as follows: PV = FV/(1+.0567)^Y, where “Y” equals the years from 2011 to the year in question.
The 3rd calculation, therefore, is the sum of all the numbers in the far right column, “base year PV of benefit.” This amount, $14,311, is the present value of the future pension benefits earned by one participant in a single year.
This all leads to the amount in the green results cell, “projected normal annual pension contribution for the entire workforce.” When the present value of one representative participant’s annual benefit accrual, $14,311, is multiplied by the number of participants in the pension plan, the result is how much money must be contributed to the pension fund in that year; the “normal contribution.”
In this example, using known data and this logic, the required normal contribution into California’s consolidated public employee pension funds in the year ended 6-30-2011 would have been 16.6 billion.
TABLE 4 – NORMAL PENSION CONTRIBUTIONS (OFFICIAL AMOUNT NOT DISCLOSED)
* * *
CONCLUSION
While the complete financial mechanics of this model are not necessarily immediately obvious, anyone with access to the data who has basic spreadsheet knowledge can use this model. By inputting the variables into the yellow cells in the model, one may evaluate any pension plan’s financial statements and perform “what-if” analysis using differing assumptions.
Except for the “normal contribution (known)” tab, the baseline model available for downloading has default values – which can be changed by the user – entered in the yellow cells that attempt to replicate the the consolidated financial status of all of California’s public employee pension plans. It is interesting to observe that when entering these values, using the sources and assumptions as described, the following changes to the financial condition of California’s public employee pensions would be indicated as of 6-30-2011:
All California Public Sector Pensions – Revalued Unfunded Liability:
Officially reported unfunded liability = $158 billion.
Revalued unfunded liability at 5.7% annual rate of return (discount rate) = $315 billion.
All California Public Sector Pensions – Revalued Annual Required Contribution:
Officially reported total pension contributions (normal and catch-up) = $27.6 billion.
Revalued total pension contributions (normal and catch-up) = $43.3 billion (based on a estimated normal contribution of $16.6 billion and a catch-up contribution of $26.7 billion.
* * *
Footnotes:
(1) Moody’s “Revised New Approach to Adjusting Reported State and Local Government Pension Data,” released in April 2013.
(2) Public Retirement Systems Annual Report for the fiscal year ended June 30, 2011, page xv, Figure 2.
(3) Moody’s Request for Comment, July 2, 2012, Adjustments to US State and Local Government Reported Pension Data, page 6.
(4) Public Retirement Systems Annual Report for the fiscal year ended June 30, 2011, ref. “Interest Rate Assumptions,” page xiii.
(5) Citibank Pension Liability Index, as posted on the date of the valuation.
(6) Moody’s “Revised New Approach to Adjusting Reported State and Local Government Pension Data,” ref. “The Adjustments,” #3, “Amortized adjusted net pension liability.”
(7) Citibank Pension Liability Index, as posted on the date of the valuation. The recommended rate will change depending on what the closing date is for the financial statements being analyzed.
(8) Moody’s Request for Comment, July 2, 2012, Adjustments to US State and Local Government Reported Pension Data, ref. “New Discount Rate Applied to Normal Cost,” page 8.
(9) Public Retirement Systems Annual Report for the fiscal year ended June 30, 2011, ref. “Interest Rate Assumptions,” page xiii.
(10) Citibank Pension Liability Index, as posted on the date of the valuation.
(11) Public Retirement Systems Annual Report for the fiscal year ended June 30, 2011, ref. Figure 12 “Public Employee Retirement System Revenues, Reporting Year 2010-11,” page xii.
(12) California 2011 Public Employment and Payroll Data, state government, and California 2011 Public Employment and Payroll Data, local government.
(13) Moody’s Request for Comment, July 2, 2012, Adjustments to US State and Local Government Reported Pension Data, ref. “New Discount Rate Applied to Normal Cost,” page 8.
(14) Citibank Pension Liability Index, as posted on the date of the valuation.
* * *
About the Author:
Ed Ring is the research director for the California Policy Center and the editor of UnionWatch.org. Before joining the CPPC, he worked in finance and media, primarily for start-up companies in the Silicon Valley. As a consultant and full-time employee for private companies, Ring has done financial modeling and financial accounting for over 20 years, and brings this expertise to his analysis and commentary on issues of public sector finance. Ring has an MBA in Finance from the University of Southern California, and a BA in Political Science from UC Davis.