
Calculating California’s Total State and Local Government Debt
SUMMARY: The total outstanding government debt confronting California’s taxpayers is bigger than is generally known. Earlier this year, when Governor Brown referred to the $27.8 billion in state budgetary borrowings as a “Wall of Debt,” his intention was probably to warn Californians that balancing the state budget was only a first step towards achieving financial sustainability.
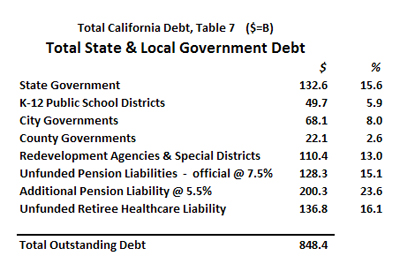
This study compiles information on California’s state and local government debt, relying primarily on official reports prepared by the State Controller and State Treasurer. When, along with the $27.8 billion “Wall of Debt,” long-term debt incurred by California’s state, county, and city governments, along with school districts, redevelopment agencies and special districts are totaled, the outstanding balance is $383.0 billion. The officially recognized unfunded liability for California’s public employee retirement benefits – pensions and retirement health care – adds another $265.1 billion. Applying a potentially more realistic 5.5% discount rate to calculate the unfunded pension liability adds an additional $200.3 billion. All of these outstanding debts combined total $848.4 billion. The study also shows that by extrapolating from available data that is either outdated or incomplete, and using a 4.5% discount rate to calculate the unfunded pension liability, the estimated total debt soars to over $1.1 trillion.
The conclusion of this study is (1) the outstanding debt owed by California’s state and local governments, using responsible actuarial assumptions, is almost certainly in excess of $1.0 trillion, and (2) it is surprising that none of our government institutions in California can themselves provide an authoritative estimate of total state and local government debt, updated annually and available to the public.
This study is part of an ongoing CPPC project to provide a more transparent view of California’s state and local government finances. An earlier CPPC study “The California Budget Crisis – Causes and Recommendations, published in December 2012, focused on budget issues and comparisons to other states.
* * *
INTRODUCTION
While in theory there is a single number that represents the correct total for all of California’s state and local government debt currently outstanding, in practice it is impossible to calculate this number. Most outstanding government debt in California is incurred locally, in literally thousands of school districts, special districts, redevelopment districts, cities, and counties. The reports from the State Controller that compile the individual annual financial reports from these thousands of entities are issued fifteen months after their fiscal year ends. Since 2003, the State Controller was no longer responsible for reporting school district debt. We were not able to find any other source for this information.
Starting in 2014, the Government Accounting Standards Board will enforce a new ruling requiring unfunded liabilities for future retirement benefits to be included on government balance sheets as long-term debt. Even without this ruling, these unfunded obligations belong in any complete compilation of government debt. But the actuarial assumptions necessary to determine how much of a future financial obligation should have been already funded today have a huge impact on the calculation. For this reason, in this study we present three sets of assumptions for unfunded pensions, based on the official rate of return currently used by pension funds, 7.5%, along with more conservative rates of return, 5.5% and 4.5%. With respect to government obligations to fund retirement health care benefits, estimating how much should have already been funded today is complicated even further because the obligation is for a defined service, not a defined payment as is the case with pensions. We have provided two estimates to take into account available data, but as will be explained, believe both estimates to be short of what is likely to be an accurate total.
While unfunded retirement obligations are considered government debt and were included in this study, not included are the hundreds of billions in deferred maintenance and upgrades to California’s infrastructure. Nonetheless, to the extent California’s government has not maintained investment in infrastructure maintenance and upgrades to keep up with normal wear and to keep pace with an expanding population, it has passed this cost on to future generations.
What should be apparent as the many categories of government debt are evaluated in this study is that much of it might be characterized as “bad debt.” There are several broad categories of debt as follows:
1. Debt that is an investment in an asset that generates a future income by way of taxes or fees sufficient to pay off the interest and principle on the debt. A toll road or water treatment plant would be an example.
2. Debt that is an investment in an asset such as a new highway or government building that would be used by future taxpayers who are responsible for paying the interest and principle on the debt by way of taxes or fees.
3. Debt and unfunded obligations that is used to cover current expenses but paid for by future taxpayers. This form of debt is essentially deferred taxation and passes a current expense to future taxpayers. Examples of this form of debt are lease obligation bonds, pension obligation bonds, unfunded retirement health care obligations, and unfunded pension benefits.
With some exceptions, we consider the first two of these categories as good debt. The third is bad debt from a taxpayers’ point of view. Borrowing to pay the current portions of payments due to fund future retirement obligations means compounding the payments due going forward.
There are additional questions that remain to be addressed. We have not looked at trends. How much faster has state and local debt grown compared to the state’s economy that has to support the debt? We have not made any attempt to determine if the level of debt is beyond what the state can afford to service or what the impact of future interest rate increases may have on the ability of state and local government entities to service this level of debt in the future.
The remainder of this report will compile outstanding debt by issuer, starting with the state government, followed by K-12 public schools, cities, counties, special districts, and redevelopment agencies. It will then examine, using various assumptions as noted, the unfunded liabilities for retiree health care and pensions.
STATE GOVERNMENT BORROWING
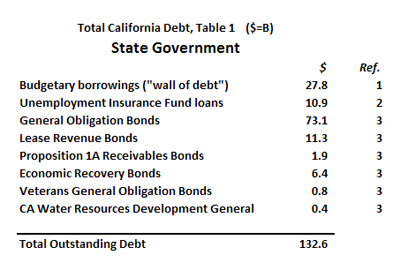
Short and long-term debts incurred directly by the state government total $132.6 billion as depicted on Table 1. In addition to the “Wall of Debt” incurred through budgetary borrowings, there is a $10.9 billion loan balance in California’s unemployment insurance trust fund account, along with $93.9 billion in various types of outstanding state issued bonds. As noted in the footnotes (as numbered in the “ref.” column beside each figure on every table in this report), these figures came from the Governor’s Budget Summary, the U.S. Dept. of Labor, and the State of California Debt Affordability Report of Oct. 2012. For all debt figures reported in this study, the reader may click on the footnote links. For verification, in the Footnotes section, not only are the direct links provided to the source documents, but a description of the exact page and table where every debt figure is located.
K-12 PUBLIC SCHOOL BORROWING
The currently outstanding long-term debt incurred by K-12 public school districts in California is not easily compiled. Every year, for California’s cities, counties, redevelopment agencies, and special districts (as summarized on Tables 3, 4, and 5), the State Controller publishes an annual financial report. In each of these financial reports the consolidated outstanding long-term debt for all of these entities is disclosed. But as confirmed by the State Controller’s office, they have not produced an annual report for K-12 public school districts since 2003, for the fiscal year ended 12-31-2000 (School Districts Annual Report, FYE 6-30-2000).
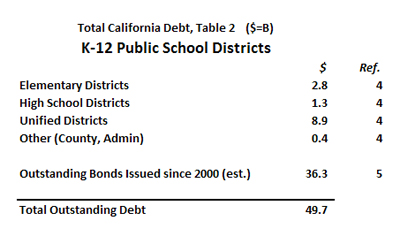
Because the available consolidated data for K-12 public school district debt comes from a State Controller’s annual report that is twelve years old, we are reporting on Table 2 outstanding debt through 12-31-2000 of $13.4 billion, but we had to turn to other sources to develop a current estimate. The California Debt and Investment Advisory Commission (CDIAC) compiles data on bond issues by state and local government entities, but their reports do not differentiate between new issues of bonds and refinancing of existing bonds outstanding. CDIAC did provide us a spreadsheet (download CDIAC bond data and analysis – 6.9MB) showing all bonds issued between January 1, 2000 and December 31, 2012.
A review of the CDIAC data shows that during the thirteen years through the end of 2012, the state and local government entities in California issued 22,738 bonds, totaling $897.1 billion. Our analysis of this data indicates that of that gross total, $641.8 billion was classified as “New Money/New Debt,” and of that total, $442.1 billion had a cancellation date after December 31, 2012. While this could suggest that this entire sum is outstanding, it is possible that many of these bonds were refinanced prior to their maturity dates. As shown on the CDIAC spreadsheet, the total K-12 School District bonds issued between 2000 and the end of 2012, with a post-2012 maturity date, totaled $58.5 billion. To estimate how much of the pre-2000 $13.4 billion and post-2000 $58.5 billion is still outstanding, we took into account the ratio between the total reported debt outstanding as of 12-31-2012, $305.4B, and the total new bond financing since 2000 that had post-2012 maturity dates, $442 billion. It is reasonable to assume this ratio, 69.1%, represents the amount of of new bond issues since 2000, with post-2012 maturity dates, that have not been refinanced. By applying the ratio of 69.1% to the sum of the original $13.4 billion in bonds and the 58.5 of bonds issued since 2000 (69.1% x $71.9 billion), we estimate $49.7 billion as the total bond debt currently outstanding for K-12 Public School Districts.
CITY GOVERNMENT BORROWING
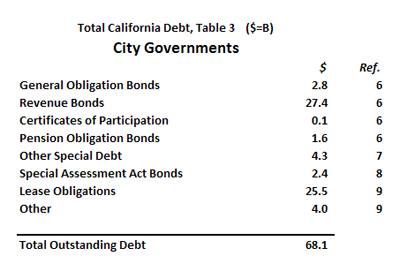
Long-term debt outstanding for California’s city governments totaled $68.1 billion according to the State Controller’s “Cities Annual Report” released in September of 2012. It is important to note that even though, unlike for K-12 School Districts, the California State Controller is releasing annual reports for cities, counties, special districts and redevelopment districts every year, this doesn’t mean the data is up-to-date. The release dates of these annual financial compilations lag the fiscal year ends by 15 months, meaning these September 2012 annual reports refer to fiscal years ending 6-30-2011. For all practical purposes, all of the information on long-term debt seen here is about two years old. One only need consider what the collective deficits – and resultant debt issues – have been in California during the past two years to understand the implications of using data from June 2011 in these estimates. Everything we’re presenting is undoubtedly understated.
Another relevant observation with respect to city and county data is that a significant portion of their long-term indebtedness is for lease obligations; for cities this total is $25.5 billion, and for counties it is $10.1 billion. To the extent these totals reflect the increasingly prevalent practice of selling government assets to meet current obligations and leasing them back in order to raise cash to cover current operating deficits, it shows just how much debt can result from this short-term fix. Ongoing payments on these leases increases the level of nondiscretionary, fixed expenses that will challenge city and county budgets for years to come.
COUNTY GOVERNMENT BORROWING
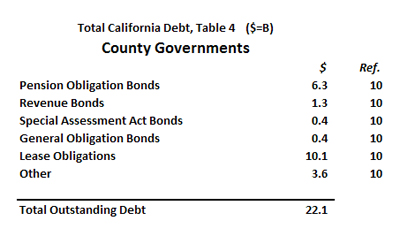
Long-term debt outstanding for California’s county governments totaled $22.1 billion according to the State Controller’s most recent annual report (Counties Annual Report), which, as noted, provides balances as of the fiscal year ended 6-30-2011. One noteworthy feature of county government debt is the significant portion of debt represented by pension obligation bonds, $6.3 billion. A pension obligation bond is issued when a city or county doesn’t have sufficient cash on hand to make their annual pension fund contribution. In some respects, these pension obligation bonds should be considered as part of California’s overall unfunded pension liability, since they represent additional debt incurred to lower the unfunded balance.
REDEVELOPMENT AGENCIES AND SPECIAL DISTRICTS BORROWING
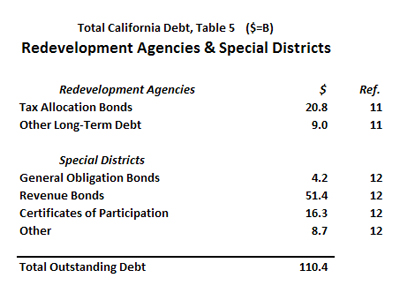
Just as any examination of California’s government debt cannot be complete unless the local government debt incurred by cities and counties and school districts are included, there are also significant state/local government assessments, expenditures and borrowing done by redevelopment agencies and “special districts.” Table 5, using data that also relies on the State Controller’s most recent annual reports (Community Redevelopment Agencies Annual Report, and Special Districts Annual Report, FYE 6-30-2011), show just how much money is owed by these entities. As of 6-30-2011, $29.8 billion was owed by California’s redevelopment agencies, and California’s many special districts owed another $80.6 billion.
As of the date this report is published, it’s not certain where the redevelopment debts will show up in the future. Redevelopment agencies have been dissolved and their outstanding debts are in the process of being transferred to other government agencies. In February 2012 425 Redevelopment Agencies were abolished and will be replaced by about 400 successor agencies responsible for paying off remaining debts.
It should be noted that the interest and principal repayments for revenue bonds are funded by the revenue from whatever specific project the proceeds were used to finance. Similarly, a “certificate of participation” is defined as “a type of financing where an investor purchases a share of the lease revenues of a program rather than the bond being secured by those revenues.” California’s special districts as of 6-30-2013 owe $51.4 billion in revenue bonds outstanding, and $16.3 billion in certificates of participation. The question to ask is whether or not revenues from new or upgraded municipal assets are being assigned to these financing instruments in cases where in the past these assets were constructed and financed without pledging their earnings to the investors. To the extent a nontraditional levy on revenue is attached to a civic asset, the government loses revenues from that asset in the future that used to be part of their income stream. The growing practice of attaching revenues from municipal assets to investor claims, like that of selling civic assets and leasing them back, are short term solutions that in the long run take revenue that will be needed to pay for future government services. These claims on future government income will have to be made up through higher taxes and fees or cuts in services.
UNFUNDED STATE AND LOCAL GOVERNMENT RETIREMENT OBLIGATIONS
If this analysis ended here, the total long-term debt owed by California’s state and local government entities would total $383.0 billion (including $27.8 billion in state budgetary borrowings which is arguably short-term debt). But unfunded retirement obligations are considered long-term debt by any reasonable accounting standard. In fact, as explored in a March 2013 study published by the CPPC entitled “How New Rules from Moody’s and GASB Affect the Financial Reporting of Pensions in Seven California Counties,” for fiscal years beginning 7-01-2013 and beyond, government entities will be required to report the underfunding of their pensions and retirement health care obligations as long-term debt on their balance sheets. The principle behind this is clear: retirement benefits are earned during the years an employee works. To the extent the pension fund assets do not equal the present value of this future liability, a debt is created.
Even without the recent GASB ruling, whether or not an unfunded pension liability constitutes long-term debt is no longer a topic of serious debate. Controversy rages, however, over just how much this unfunded liability should be worth. Calculating the level of underfunding is greatly affected by how much the pension fund projects it will earn each year on its investments. Most pension funds in California currently use a rate of return between 7.0% and 7.9%. If these rate-of-return projections are lowered, the assets in the fund will not appreciate at the same rate, and in turn either the annual contributions must be increased or the estimated amount of underfunding will be increased.
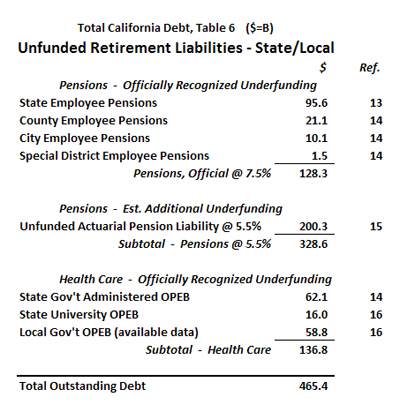
Taking all this into account, the California State Controller issues a “Public Retirement Systems Annual Report” every March. The most recent available is from March 2012, reporting on actuarial data submitted by the more than eighty state and local government employee pension funds for the fiscal year ended 6-30-2010 (their actuarial data lags their financial reporting by one year because of the time required to perform the analyses). The figures in the top portion of Table 6 for pensions, “Officially Recognized Underfunding,” are produced by the State Controller and may be considered the minimum estimates. They are based on a discount rate, or projected rate of return for these funds, which in 2010 averaged about 7.5%. According to the State Controller’s most recent annual report, the officially recognized amount of pension plan underfunding is $128.3 billion.
The middle section of Table 6 presents the additional amount that would be added to the unfunded pension liability for California’s state and local government workers if the rate of return projected for the fund were to drop from 7.5% to 5.5%. The rate of 5.5% is not selected at random, it is based on a July 2012 announcement by Moody’s Investor Services, the largest bond credit rating agency, that they intend to begin discounting future pension fund liabilities to present value at a rate of 5.5% when doing their credit evaluations for government entities. Moody’s based the 5.5% figure on the yields from high-grade corporate bonds, which are considered of moderate risk. When a stream of future payments is discounted to today’s present value at a rate of 5.5% instead of 7.5%, they necessarily become much larger numbers. Again, since the calculation of an unfunded liability is based on the value of the current fund assets, less the present value of the fund’s future liabilities, the larger the present value estimate is for that liability, the greater amount by which the value of that liability will be likely to exceed the value of the assets in the fund.
Using the 5.5% discount rate more than doubles the projected unfunded pension liability, adding another $200.3 billion to the estimate. This increase illustrates just how sensitive pension funding is to the assumptions made regarding the long term rate of return. How this amount is derived is explored in depth in the March 2013 CPPC study entitled “How Lower Earnings Will Impact California’s Total Unfunded Pension Liability.” Without discussing the mechanics of that calculation here, since the reader may refer to the March 2013 study where it is thoroughly documented, the methods used were precisely those specified by Moody’s in their July 2012 Request for Comment, and the variables used were those reported by the State Controller in the most recent Annual Report of State Retirement Systems.
The lower section of Table 6 references what is, to-date, the most nebulous of all long-term liabilities confronting California’s state and local governments, their obligations to provide health insurance benefits to their employees when they retire. Calculating the level of underfunding for retirement health care obligations uses very similar financial methods as pension obligations, with one additional complicating variable. As noted, a retirement pension is considered underfunded to the extent the present value of the future liability exceeds the current value of the fund’s invested assets. But with pensions, the future liability is based on actuarial considerations such as life expectancy and expected retirement dates, along with work history and expected final salaries (or final few years of salary, averaged) upon which to apply the pension formula. Pension liability calculations also take into account economic assumptions such as expected rates of inflation which impact the amount of future cost-of-living adjustments. These pension liability estimates are aggregated for the entire pool of participants and are refined into an actual dollar amount. With retirement health care obligations, however, it isn’t a defined financial benefit that must be quantified for all participants, but rather a defined service benefit. Nobody knows how much health care premiums are going to cost in ten, twenty, thirty years. Making an assumption for this additional necessary variable complicates projections. It should be noted that current California state employees can qualify for 50% of the maximum retirement health benefits after 10 years of employment, and 100% after 20 years. At the city and county level, in many cases, these retirement health benefits are 100% vested after even shorter periods of employment.
A few more observations are necessary to explain the estimated state and local government debt for underfunded future health care obligations to their employees. First, perhaps because of the additional complexity of these calculations, the discount rate used is typically not as aggressive as that used by the pension funds. This increases the amount of the officially estimated liability, and lowers the probability that it is understated. Second, unlike pension funds, which are actively managed with (just in California) about $600 billion in invested assets according to the State Controller’s data from 6-30-2010, almost no money has been set aside so far to fund future healthcare obligations to retirees. Third, acquiring the data to estimate the aggregate state and local retiree healthcare underfunding is not easy. The most authoritative source we found was a report by the State Budget Crisis Task Force, issued in 2012, that estimated California’s total underfunding to be $136.9 billion. Because the analysts claimed they were not able to acquire data from all of the state and local government entities who have made these commitments, this is undoubtedly a minimum estimate.
CALIFORNIA’S TOTAL STATE AND LOCAL GOVERNMENT DEBT
As should be evident, it is impossible to precisely calculate California’s total state and local government debt. Table 7 shows a summary of the data, but every one of those numbers should be questioned. Our approach was to use totals that were, if anything, underestimating the actual obligations. Here are factors that should be considered for each of these estimates:
All of the data from the State Controller’s Annual Reports – our primary source for K-12, City, County, Redevelopment Agency, and Special District borrowing – is nearly two years old. The reader may consider which scenario is most likely: That in the period since 6-30-2011 these entities have operated with significant budget surpluses and have reduced this debt, or during that period these entities have logged another two years of fiscal year deficits and have increased the amount of their outstanding debt?
When producing data for direct state government debt, we included short-term borrowing. This data was not readily accessible for the other entities, which in aggregate report long-term debt of $250.3 billion compared to direct state long-term debt of $104.8 billion. Simply pro-rating the $27.8 billion of state short-term borrowing according to the 2.4x greater local long-term debt compared to state long-term debt yields an estimated additional 66.4 billion in short-term debt outstanding for California’s K-12 school districts, cities, counties, redevelopment agencies and special districts.
On Table 6 we show an estimated $328.6 billion in unfunded retirement obligations for pensions, broken out as follows: $95.6 billion for state employees, $21.1 billion for county employees, $10.1 billion for city employees, $1.1 billion for special district employees, along with an additional $200.3 billion in underfunded pensions based on applying a 5.5% discount rate.
But what if the 5.5% pension fund rate of return prediction is actually too high?
A major issue is what will the pension fund rate of return be over the next 20 or 30 years, 7.5% per year, 5.5% per year or something else? The authors’ opinion favors a lower return estimate. The economic landscape that generated an historic 7.5% average rate of return for these funds has been seismically altered. Interest rates are at historically low levels because of actions by the U.S. Federal Reserve and other central banks. This reduces pension fund interest income near-term and could lead to losses on bond portfolios when interest rates eventually return to normal. The world economies are likely to grow more slowly due to aging populations, growing government debt, and higher taxes. As the population ages, there will be fewer workers to support each retiree so that taxes are likely to increase which should lower the growth of all the major world economies. With the aging populations, retirees and pension funds will become net sellers of financial assets which may reduce equity returns which would also be depressed if the world’s economies grow more slowly than in the past.
This raises an important issue. Future taxpayers, not the retirees, bear all the risk of a shortfall in pension fund returns. As currently structured, any pension underfunding has to be made up be increased pension fund contributions by state and local government organizations, not the employees. This gives the employees and their unions a big incentive to use optimistic assumptions since they have nothing to loose if actual returns are less.
Can public employee pension funds in the U.S., which now have over $3.0 trillion of invested assets, possibly avoid skewing the market when suddenly they become net sellers instead of net buyers? More generous pension formulas were only introduced in the last 10-15 years, meaning that as these people enter the retirement pool, these massive pension funds will have to start paying out as much or more in pension benefits to retirees as they are taking in pension contributions from active workers.
What about the fact that America’s citizens over 65 years old will double, from 11% of the population in 1980 to 22% of the population by 2030? Won’t this mean that twice as many people – as a percent of the U.S. population – will be selling their assets to finance their retirement, instead of buying assets in order to save for retirement? Won’t this also put downwards pressure on investment assets? What about the debt binge that has seen total market debt (public and private) as a percent of GDP nearly triple in the last 40 years, to over 350% of GDP?
Can future rates of economic growth, which fuels the rate of price appreciation for invested assets, maintain the pace it logged in the past when net borrowing was increasing – pushing cash into the economy – now that net borrowing has reached its limit and is now declinging as companies, banks and individuals take actions to reduce their debt burdens?
As referenced in our February 2013 CPPC study on the connection between rates of return and the level of unfunded returns for pensions in California, if the sustainable rate of return for these funds lowered to 4.5% per year, which is not all that unlikely, the total unfunded pension debt would increase as follows: $128 billion at 7.5% (official), $329 billion at 5.5% (Moody’s), and $450 billion at 4.5%. These findings are consistent, if not somewhat lower, than the numbers reported in a definitive study from December 2011, Pension Math: How California’s Retirement Spending is Squeezing The State Budget, conducted by a Stanford University team led by economist and former Democratic state assemblyman Joe Nation. In that study, they estimated that even a 4.5% rate of return was only about 80.9% likely to be achieved by the pension funds (compared to a dismal 50.7% probability of achieving a 7.1% rate of return), and that at a 4.5% rate of return, these funds in aggregate would be less than 50% funded. A 4.5% rate of return assumption for pension funds adds $121 billion to the unfunded liability.
Finally, what about the unfunded liabilities for retirement health care for California’s nearly 1.5 million state and local government workers? On Table 7, $136.9 billion of the officially recognized total of $265.1 billion for future retirement obligations is for health care. And as noted, this is using incomplete data. Instead of setting aside and investing assets when the employees are working, assets that can eventually be used to pay these healthcare premiums, most of California’s state and local government agencies are engaging in a pay-as-you go funding. And as the costs for healthcare have escalated at rates far exceeding the rate of inflation for decades, this liability has grown proportionally. How much might really be owed? Estimating the true value of the unfunded healthcare liability is well beyond the scope of this analysis, but it would be conservative to assume the official number could be increased by 50%, or by another $68.5 billion.
CONCLUSION
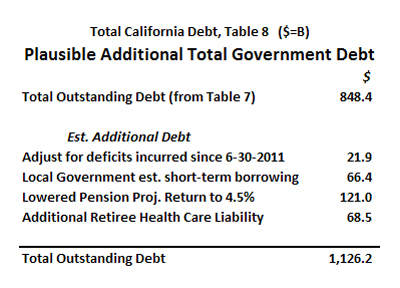
To our knowledge, there is no source of previously compiled data that attempts to estimate California’s total outstanding state and local government debt. The amount we calculated as summarized on Table 7 we consider to be an absolute best case, $848.4 billion. Here are what we consider reasonable estimates of how much more may actually be owed as of the end of this fiscal year – June 30, 2013:
Adjusting for deficits incurred since 6-30-2011: The fact that the State Controller’s data for K-12 schools, cities, counties, special districts and redevelopment agencies is two years old suggests the reported $250.3 billion would have increased. In our December 2012 CPPC study “The California Budget Crisis – Causes and Recommendations,” we estimated the combined budget for these entities to be $218.9 billion per year (Chart 2). If we assume these entities have all incurred 5% budget deficits over the past two years which have translated themselves into long-term instruments such as pension obligation bonds, capital appreciation bonds, revenue bonds, special assessment bonds, etc., add $21.9 billion.
Accounting for local government short-term loans: Short-term borrowing is typically rolled over from year to year, representing outstanding payables that are not necessarily converted into long-term debt. As noted already, if one merely applies the ratio of short-term to long-term debt that applies at the state level to the local entities, this would yield an estimated additional $66.4 billion in debt.
Making realistic assumptions with respect to funding retirement benefits: If pension funds only earn 4.5% instead of 5.5% – not unlikely in our debt saturated economy and aging society – add another $121 billion to the unfunded liability. And it is probably an underestimate to merely increase our projected unfunded retirement health coverage liability by 50%. Adding another $68.5 billion is conservative.
Based on our investigation, the reported $848.4 billion in total state and local government debt in California is a low estimate. Adding $21.9 billion in new long-term debt incurred by K-12 schools, cities, counties, special districts and redevelopment agencies over the past two years, $66.4 billion in rolling short-term debt accruing to these same entities, $121 billion in additional unfunded pension liabilities based on a 4.5% discount rate, and $68.5 billion in additional liabilities for future retirement healthcare, and that $848.4 billion swells to a whopping $1.13 trillion. That’s about $30,000 each for every resident of the Golden State; over $80,000 per household.
It is important to reiterate that compiling these numbers with absolute accuracy is nearly impossible with currently available data. It should be of concern to any citizen in California that not one entity in state government is officially tasked with consolidating the data on California’s total state and local government debt. Experts on this topic are invited to present their own data, or explain why any reasonable analysis of what we have uncovered here would contradict the following statement: California’s state and local government entities, combined, now owe over $1.0 trillion in outstanding debt.
* * *
Footnotes (ref.):
1 – Governor’s Budget Summary-2013-14, January 2013, Introduction, Page 7, Figure INT-03
2 – National Conference of State Legislatures (NCSL), January 2013, Unemployment Insurance: State Trust Fund Loans
3 – California Treasurer’s Debt Affordability Report, October 2012, page 7, Figure 9
4 – School Districts Annual Report, FYE 6-30-2000, page vii, Figure 6
5 – CPPC Analysis of CA Debt & Advisory Commission Data, April 2013, Table 2 (6.9 MB)
6 – Cities Annual Report, FYE 6-30-2011, page xxix, Figure 24
7 – Cities Annual Report, FYE 6-30-2011, page xxix, “Long-Term Indebtedness – Other Special Debt”
8 – Cities Annual Report, FYE 6-30-2011, page xxx, Figure 25
9 – Cities Annual Report, FYE 6-30-2011, page xxxi, Figure 26
10 – Counties Annual Report, FYE 6-30-2011, page 249, Table 6
11 – Community Redevelopment Agencies Annual Report, May 2012, Introduction, page i
12 – Special Districts Annual Report, FYE 6-30-2011, page ix, Figure 6
13 – State Controller Public Retirement Systems Annual Report, FYE 6-30-2010 (rel. 3-30-2012), page xv, Figure 2
14 – Governor’s Budget Summary-2013-14 dated January 2013, Introduction, page 7, Figure INT-04
15 – CPPC Study “How Lower Earnings Will Impact CA’s Total Unfunded Pension Liability,” Feb. 2013, 2nd Chart
16 – Report of the State Budget Crisis Task Force, July 2012, page 44, Table 13
About the Authors:
William Fletcher is an experienced business executive with interests in public finance and national security. He retired as Senior Vice President at Rockwell International where most of his career was spent on international operations and business development for Rockwell Automation. Before joining Rockwell, he worked for Bechtel Corporation, McKinsey and Company, Inc., and Combustion Engineering’s Nuclear Power Division, and was an officer and engineer in the U.S. Navy’s nuclear program. His international experience includes expatriate assignments in Hong Kong, Europe, the Middle East, Africa and Canada. In addition to his interest in California’s finances, he is involved in organizations dealing with national security and international relations. Fletcher is a graduate of Tufts University with a BS degree in Engineering and a BA degree in Government. He also graduated from the U.S. Navy’s Bettis Reactor Engineering School.
Ed Ring is the research director for the California Policy Center and the editor of UnionWatch.org. Before joining the CPPC, he worked in finance and media, primarily for start-up companies in the Silicon Valley. As a consultant and full-time employee for private companies, Ring has done financial modeling and financial accounting for over 20 years, and brings this expertise to his analysis and commentary on issues of public sector finance. Ring has an MBA in Finance from the University of Southern California, and a BA in Political Science from UC Davis.