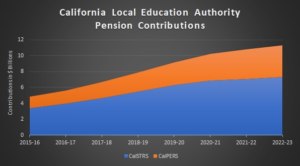
California school district pension contributions on track to exceed $11 billion by 2023
C
alifornia school and community college districts are contributing $5.6 billion to CalSTRS and CalPERS during the current school year. These contributions will total $6.7 billion in the next school year, and, according to CPC’s analysis of actuarial projections, they will reach $11.3 billion in the 2022-2023 school year.
In 2015-2016, CalPERS and CalSTRS collected $4.8 billion from California local educational authorities and have published district-by-district breakdowns of these payments. We compared the district level contribution data with total district revenues reported to the state’s Department of Education. On average, districts paid 4.86% of revenue to the pension systems. There was relatively little variation in pension contribution to revenue ratios across districts with the vast majority falling into a range of 4% to 6%. You can see these ratios in this spreadsheet.
Both systems assess a standard employer contribution rate (as a percentage of payroll) for all employees. In 2015-2016, the contribution rates were 10.73% for CalSTRS and 11.85% for CalPERS. These rates will climb over the next few years as the two systems attempt to fill funding shortfalls and move to more conservative discount rates. CalSTRS rates will grow more slowly than CalPERS rates because the state is increasing the degree to which it subsidizes teacher pensions. State contributions to CalSTRS are projected to grow from $1.8 billion in 2016-2017 to $2.3 billion in 2022-2023.

| 2016-17 | 2017-18 | 2018-19 | 2019-20 | 2020-21 | 2021-22 | 2022-23 | |
| CalSTRS and CalPERS Total | $5,618,181,228 | $6,697,416,698 | $7,886,655,302 | $9,165,485,481 | $10,246,568,417 | $10,794,351,673 | $11,290,014,803 |
| CalSTRS | |||||||
| Payroll | $31,303,000,000 | $32,398,000,000 | $33,352,000,000 | $34,706,000,000 | $35,920,000,000 | $37,178,000,000 | $38,479,000,000 |
| Employer Base Contributions | $2,582,000,000 | $2,673,000,000 | $2,766,000,000 | $2,863,000,000 | $2,963,000,000 | $3,067,000,000 | $3,175,000,000 |
| Employer Supplemental Contributions | $1,356,000,000 | $2,002,000,000 | $2,693,000,000 | $3,429,000,000 | $3,897,000,000 | $4,034,000,000 | $4,175,000,000 |
| Total Employer Contributions | $3,938,000,000 | $4,675,000,000 | $5,459,000,000 | $6,292,000,000 | $6,860,000,000 | $7,101,000,000 | $7,350,000,000 |
| Total Employer Rate | 12.58% | 14.43% | 16.37% | 18.13% | 19.10% | 19.10% | 19.10% |
| CalPERS | |||||||
| Payroll | $12,098,079,119 | $13,021,806,052 | $13,412,460,234 | $13,814,834,041 | $14,229,279,062 | $14,656,157,434 | $15,095,842,157 |
| Employer Normal Cost | $997,121,741 | $1,055,145,859 | |||||
| Unfunded Rate Contributions | $683,059,487 | $967,270,839 | |||||
| Total Employer Contributions | $1,680,181,228 | $2,022,416,698 | $2,427,655,302 | $2,873,485,481 | $3,386,568,417 | $3,693,351,673 | $3,940,014,803 |
| Total Employer Rate | 13.89% | 15.53% | 18.10% | 20.80% | 23.80% | 25.20% | 26.10% |
Sources:
CalPERS actuarial analysis: https://www.calpers.ca.gov/docs/board-agendas/201704/financeadmin/item-8a-00.pdf
CalPERS 2015-2016 contributions by district: https://www.calpers.ca.gov/docs/forms-publications/gasb-68-schools-schedules-2016.pdf
CalSTRS actuarial analysis: http://resources.calstrs.com/publicdocs/Page/CommonPage.aspx?PageName=DocumentDownload&Id=a73c0f09-405c-42a5-86d2-2587d6926e65
CalSTRS 2015-2016 contributions by district: http://www.calstrs.com/sites/main/files/file-attachments/other_pension_information_2015-16.pdf
