
California’s Public Sector Compensation Trends
SUMMARY
This report calculates the average compensation and benefits for California’s full-time state, city and county government workers during 2015, using raw payroll data posted by the California state controller. It compares these findings to the results of a similar report issued three years ago using 2012 pay and benefit data from the California state controller. It then compares these trends to state and local government in the rest of the U.S. going back to 1995 using U.S. Census Bureau data. Using U.S. Census Bureau and California Employment Development Dept. data, it then compares state and local government pay in California to private sector pay, going back to 2000. Finally, it estimates how much the average state/local government worker pay and benefits would have to be if their pensions were adequately funded. This study focuses on California’s cities, counties and state agencies and does not examine pay and benefit data or trends for K-12 or college and university public employees.
Here is a summary of key findings:
(1) In 2012, the average pay and benefits for a full time employee in a California city was $124,058; county workers, $102,312; state agencies, $100,668.
(2) By 2015, these total compensation averages had increased as follows: Cities, $137,392, up 11% in three years; counties, $117,425, up 15%; state agencies, $116,887, up 16%. Adjusting for inflation of 3.02%, real compensation growth was 7.3% in cities, for counties it was 11.2%, and for state agencies it was 12.5%.
(3) Average 2015 total compensation for full-time state/local workers by category found the following:
– Cities: public safety $171,450, miscellaneous (all other employees) $121,431.
– Counties: public safety $170,728, miscellaneous $108,857.
– State Agencies: public safety $137,531, miscellaneous $104,867.
(4) Between 2012 and 2015 there was a strong correlation between growth in employer costs for overtime and growth in employer costs for pension contributions. Overtime pay was up in 2015 compared to three years ago by 35% for cities, 60% for counties, and 32% for state agencies. Similarly, pension contributions were up in 2015 compared to three years ago by 14% for cities, 26% for counties, and 42% for state agencies.
(5) In 2015, the pay (not including benefits) for California’s city and county employees exceeded pay for workers in cities and counties in the rest of the U.S. by 39%; California’s average public safety worker pay exceeded that of their counterparts across the U.S. by 78%; miscellaneous worker pay in California was 16% greater than in the rest of the U.S.
(6) In both California and in the rest of the U.S., between 1995 and 2015, pay for state, city and county workers grew by between 77% and 87%. The CPI (consumer price index) increased by 55% during that same period.
(7) Between 2000 and 2015, average private sector pay for full-time workers in California (not including benefits) increased 47%, from $37,012 in 2000 to $54,326 in 2015. During that same period, average pay for public employees in California increased by 59%, from $51,271 in 2000 to $81,549 in 2015.
(8) In 2015, the “benefits overhead” for the average private sector full-time worker in California is estimated at 15%; for state, city and county public employees, even when including overtime in the denominator, it is 40%.
(9) The composite average total compensation (pay and benefits) for a full-time city, county or state worker in California during 2015 was $121,843; for the average full-time private sector worker in California, including benefits, it was 62,475, which is 51% of what the public sector worker earned.
(10) If you take into account the necessary increases in contributions to California’s state and local pension funds in order to keep them solvent and keep promised retirement benefits intact, the average total compensation (pay and benefits) for a full-time city, county or state worker in California during 2015 was $139,691.
INTRODUCTION
Three years ago the California Policy Center published an analysis of public sector pay and benefits for the year 2012. Using the same sources and methods, this report is to provide updated 2015 numbers. Our source for this information is the State Controller’s “Government Compensation in California” website which provides information on employee pay and benefits for approximately 2 million positions at more than 5,000 state and local public employers.
What level of public employee pay and benefits are affordable and appropriate is a difficult but necessary discussion. The analysis we performed in 2012 may have been one of the earliest attempts to extract from the raw data the average pay and benefits for full-time employees of California’s cities, counties, and the state government.
One of the biggest weaknesses inherent in the State controller’s “Government Compensation in California” database is that the summary information by agency provides averages that include records for employees who only worked part-time, or who only worked for part of the fiscal year. As will be discussed in the next section, however, the State controller’s compensation website provides Excel spreadsheets on their “downloads” page that include a detailed annual pay record for literally every public employee working in state or local government. These spreadsheet records yield sufficient additional information to accurately estimate averages limited to full-time employees.
In this report we will compare compensation and benefits data from 2012 to 2015, separating the data by cities, counties, and state agencies. We will then isolate compensation and benefits data for public safety employees and miscellaneous (all other) employees and perform the same analysis with those subsets. We will conclude with a presentation of additional findings using data, where available, going back as far as 1995, comparing California’s public sector compensation trends to reported private sector compensation data, as well as to changes in the consumer price index. Along with the State Controller, our sources include the U.S. Census Bureau, the U.S. Bureau of Labor Statistics, and the California Employment Development Department.
* * *
METHODS AND ASSUMPTIONS TO ISOLATE FULL-TIME EMPLOYEE RECORDS
The method to remove part-time records from our analysis in order to develop compensation averages for full-time employees of California’s cities, counties, and state government, using the State controller’s raw data, rests on four assumptions. They are:
(1) A full-time employee would participate in a health insurance plan to which the employer would contribute some portion of the required payment, however minimal.
(2) A full-time employee would participate in a retirement benefit plan, usually a pension, to which the employer would contribute some portion of the required payment, however minimal.
(3) A full time employee would earn an amount in “regular pay” at least equal to the amount specified as the “minimum pay for job classification.”
(4) To screen out interns, elected officials, and any other employee classifications that are not clearly full-time positions, we eliminate any records where the reported “regular pay” is less than $30,000 per year.
It is important to note that the pool of full time employees that is isolated using this analysis does not necessarily include all records of full-time employees. The third condition that must be met, for example, that requires a “full time” employee to have earned an amount in “regular pay” at least equal to the amount specified as the “minimum pay for job classification,” will exclude employees who only worked a partial year (typically because during the year they either were hired, retired, or transferred into or out of that job) and therefore earned less than the minimum. But “partial-year” employees must be excluded from the analysis because their lower earnings are not representative of what they would have earned if they’d been in the position the full year.
Another factor worth explaining are end of career payouts of, for example, accrued sick time, which could potentially skew averages upwards. In reality the opposite is probably true, because (1) this deferred compensation that occurs whenever an employee retires is an accurate reflection of what they were earning throughout their career, and so unless a disproportionate number of employees retire and collect payouts in the year under analysis, these payouts belong in the averages, and (2) a significant number of retirees do not work the full year and are therefore screened out based on condition #3 because their “regular pay” did not equal or exceed the “minimum pay for job classification.
Because of the sheer size of the pool, even with the weaknesses noted, it is unlikely the results generated are not accurate. They draw from a database that literally includes every single employee under the payroll of any city, county, or state agency in California. In all, 291,011 city employee records were analyzed, 350,150 county employee records, and 239,860 state agency employee records. To verify the methods and the data, the reader is invited to download each of these Excel files, which were created by downloading the State controller’s raw data files and modifying them:
AVERAGE TOTAL COMPENSATION, FULL-TIME EMPLOYEES – 2015 vs 2012
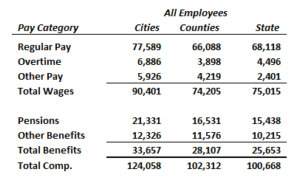
Using data provided by the California state controller, Table 1 below displays 2012 average pay by category – regular pay, overtime, other pay, pension benefits, and other benefits. Subtotals are provided for total pay and total benefits, along with total compensation which represents all employer costs – pay and benefits – for the average full time worker. The columns provide data for California’s cities, counties, and state agencies.
Table 1 – Public Sector Pay in California
Average Pay and Benefits for Full-Time Workers, 2012
As can be seen, the average full-time city employee in California during 2012 earned $124,058, the average full-time county employee earned $102,312, and the average full-time state worker earned $100,668. How does this compare to 2015, three years later?
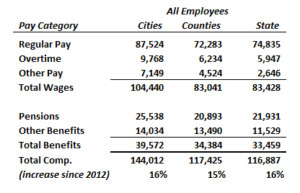
Table 2 – Public Sector Pay in California
Average Pay and Benefits for Full-Time Workers, 2015
As can be seen on Table 2, over the past few years compensation for full-time state and local government workers has increased by about 16% across cities, counties and state agencies. If you adjust this for changes in the Consumer Price Index between December 2012 and December 2015, it doesn’t change much. The CPC in 12/2012 was 229.601, moving up to 236.525 in 12/2015, a move of 3.02% which compounded is less than 1.0% per year. Put another way, after adjusting for inflation, over the last three years the average full time city worker in California saw their pay and benefits increase by 7.3%, for counties it was 11.2%, and for state agencies it was 12.5%.
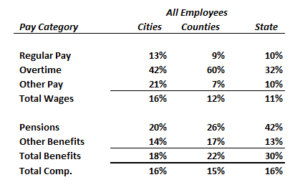
Table 3 depicts the percentage increase (not adjusting for inflation) by category of compensation. Predictably, much of this growth occurred in the amount of pension contributions, 20% in cities, 26% in counties, and 42% in state agencies. The other significant area of pay increases were in overtime, 42% in cities, a whopping 60% in counties, and 32% in state agencies. This is more than correlation – when the overtime rate of 1.5x regular pay exceeds the rate of employee benefits as a percent of pay, it is financially preferable to pay fewer workers overtime than to hire more workers.
Table 3 – Public Sector Pay in California
Percent Change in Average Pay for Full-Time Workers Between 2012 and 2015
AVERAGE TOTAL COMPENSATION, PUBLIC SAFETY EMPLOYEES – 2015
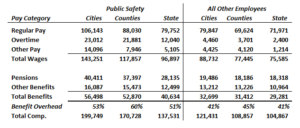
The causal relationship between pension and other benefit costs and overtime becomes clearer on Table 4, which depicts the average full-time public sector worker’s pay and benefits when splitting the employees into public safety and miscellaneous (all other employees) categories. As can be seen, in 2015 all categories of public safety benefits overhead averaged in excess of 50%, in cities it was 53%, in counties it was 60%, and in state agencies it was 51%. By contrast, among miscellaneous employees where benefits overhead averaged closer to 40%, overtime expenses were relatively insignificant. This causation is further supported by the data showing that in California counties, where pension costs have driven the benefits overhead rate to the highest level, 60%, the increase to overtime charges between 2012 and 2015 (Table 3) was also the highest, at 60%.
Since only regular pay (and some categories of “other pay,” but not overtime) is considered pension eligible, if benefit overhead exceeds 50% of regular pay, it makes more financial sense to pay time-and-a-half than to hire more workers.
Table 4 – Public Sector Pay in California
Pay, Benefits, and Benefit Overhead for Public Safety and Miscellaneous Workers, 2015
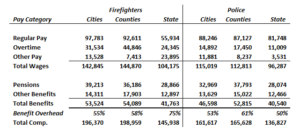
While evaluating public safety pay and benefits, it is interesting that a sharp disparity exists between the average pay and benefits earned by full-time police compared to full-time firefighters. As depicted in Table 5, it can be seen that full-time firefighters in California’s cities earned on average in 2015 a total compensation of $196,370; cities, $198,938; state agencies, $145,938. This compares with police in California’s cities who earned on average $161,617; counties, $165,628; state agencies, $136,827. This disparity between firefighter and police earnings is inexplicable or appropriate, depending on who you ask. Also of note is the fact that state agencies pay their police and firefighters much less than cities and counties.
Table 5 – Public Sector Pay in California
Pay, Benefits, and Benefit Overhead for Police and Firefighters, 2015
TOTAL COMPENSATION TRENDS 1995-2015, CALIFORNIA VS. REST-OF-USA
Another way to assess public sector pay in California is to compare it to US Census Bureau data. Unfortunately the census bureau data is limited to payroll, which means we cannot track growth in costs for benefits. But the data does allow a comparison between payroll costs for miscellaneous employees vs. public safety employees, between payroll costs for local (cities and counties combined) agencies and state agencies, and between payroll costs between California’s agencies and their counterparts in the rest of the U.S.
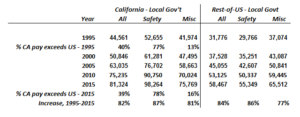
Table 6 shows payroll trends for California’s local governments between 1995 and 2015, compared with the rest-of-the U.S. The bottom line of data indicates that in both California and the rest of the U.S., the rate of pay between 1995 and 2015 – with only slight variations – increased by around 80%. What can also be seen was that the overall average pay for California’s cities and counties exceeded the overall average for the rest of the U.S. by 40%, but with widely varying percentages between miscellaneous employees, whose pay only exceeded the national average by 13%, and public safety employees, whose pay exceeded the national average by 78%.
Table 6 – Public Sector Pay in California
Average Pay, California Local Governments vs. Rest-of-U.S., 1995-2015
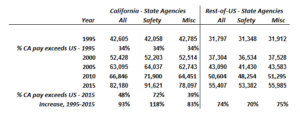
Comparing rates of pay for California state agencies vs state agencies in the rest of the U.S. yields somewhat similar trends with one notable exception. As shown on Table 7, in the rest of the U.S., average pay overall, and within the subsets of public safety and miscellaneous employees, increased between 1995 and 2015 by 70% to 75%. In California, however, the amount of increase varied a great deal. While miscellaneous employees saw their average pay increase by 83% between 1995 and 2015, public safety employees saw their average pay increase by 118%.
As can be seen on the 2nd to last row of data on Table 7, the average annual pay for public safety employees in California’s state agencies now exceeds the average for their counterparts in the rest of the U.S. by 72%. For local governments in California (Table 6), public safety pay averages 78% greater than in the rest of the U.S. By contrast, miscellaneous employees are paid more than their counterparts in the rest of the U.S. – 16% more in local governments and 39% more in state agencies – but their advantage is less than half that of public safety employees.
Table 7 – Public Sector Pay in California
Average Pay, California State Agencies vs. Rest-of-U.S., 1995-2015
It is relevant to note that the Consumer Price Index between 1995 and 2015 increased by 55%, meaning that in real dollars, we are seeing public sector rates of pay increase – in both California and the rest of the U.S. – between 1995 and 2015 at around 25% in excess of the rate of inflation during that period.
TOTAL COMPENSATION TRENDS 1995-2015, CALIFORNIA PUBLIC VS. PRIVATE SECTOR
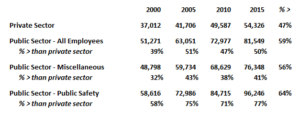
By relying on U.S. Census Bureau data for public sector salaries and wages, and California EDD (Employment Development Dept.) data for private sector salaries and wages, information is available starting in 2000 through 2015 for comparisons. Unfortunately, 1995 data was not available from the EDD for California workers. Table 8 depicts the wage growth trends for public and private sector workers in California between 2000 and 2015, including breakouts between miscellaneous government employees and public safety employees.
Table 8 – Public Sector Pay in California
Average Pay, California Public Sector vs. Private Sector, 2000-2015
As depicted in the far right column on Table 8, average private sector salaries and wages increased by 47% between 2000 and 2015. By comparison, all public sector employee wages increased by 59% during that same period, with miscellaneous employee wages rising 56% and public safety employee wages rising 64%. As a consequence, as can be seen on the three rows “% > than private sector” (indicating the percent by which public sector pay exceeds private sector pay) beneath each category of government employee, the disparity between public sector and private sector wages became more pronounced over the past 15 years.
Because information on average private sector employee benefits was not available from the EDD, the U.S. Census Bureau, the Bureau of Labor Statistics, or any other source we could identify, it is necessary to impute this number. While the precision of this estimate will necessarily constitute a range of plausible amounts, this will nonetheless yield meaningful comparisons of average total compensation in the private sector vs. in the public sector. As it is, our exhaustive review of the detailed individual compensation records for every city, county, and state worker employed in 2015 in California, gives us a high level of confidence that our results for them as primarily reported on Tables 2 and 4 (and elsewhere) are very accurate.
In order to make a final comparison of total compensation averages between California’s public and private sector workers, estimates must be made of private sector benefit overhead. A practical range would be between zero – which applies to California’s more than 2.0 million independent contractors, and at least 7.65%, which is the sum of employer medicare payments (1.45%) and employer Social Security payments (6.2%). In addition, benefits must include the cost of employer paid health insurance, and the costs for employer contributions to a retirement account such as a 401K. At the high end of the range, therefore, one may impute 10% for health insurance, 3% for a matching 401K contribution, and 7.65% for the employer’s share of Social Security and Medicare, i.e., 20.65%. Insofar as it is unlikely more than half of California’s 18.3 million employed workers enjoy a full-time salaried job with this entire package of benefits, we believe it is a generous assumption to apply a 15% overhead cost to the average private sector worker in California.
As a result, we estimate that the average full-time private sector worker in California in 2015 earned total compensation of $62,475, compared to the average full-time state or local government worker earning $116,887 (state), $117,425 (counties), and $144,012 (cities). Overall, this analysis calculated the average pay and benefits for 154,570 full-time state employees, 223,420 full-time county employees, and 112,764 full-time city employees. The overall average pay for these 450,754 full time employees of California’s cities, counties and state agencies, was $86,977; average benefits, $34,867; average total compensation, $121,843. These calculations were based on a ground-up analysis of individual pay records submitted to the state controller’s office by every city, county and state agency in California. This is in contrast to our estimated total compensation for the average private sector worker in California, which at $62,475 in 2015, is a 51% of what government workers earned in that same year.
OBSERVATIONS AND CONCLUSIONS – THE IMPACT OF FUNDING THE PENSION SYSTEMS
Based on comprehensive review of available data, during 2015 it is clear that the pay and benefits for public sector workers in California’s cities, counties and state agencies make twice, on average, what private sector workers earn. It is important to note this analysis did not include any K-12 employees or higher education employees. Moreover, the methods we used to isolate full-time employees necessarily screened out not only obvious part-time workers, but also full-time workers who may not have occupied their position for a full year. This was necessary to avoid understating how much full-time workers actually earn in California’s public sector. Taking these two factors into account, it should be no surprise the actual employment rolls of California’s state and local agencies are far greater than the 450,754 records we analyzed. According to the U.S. Census Bureau, the “full-time equivalent” number of employees at local agencies in 2015 were 1,370,992; of that, 715,308 worked in public education and were not part of our analysis. Similarly, U.S. Census Bureau data show “full time equivalent” employment with the state in 2015 at 505,977; of that 254,391 worked in public education.
No discussion of current compensation and benefits for California’s public employees is complete without a discussion of the pension systems, because their solvency must be assured in order for these workers to collect in retirement the benefits they have been promised. During 2015 there were 88 public employee pension systems in California, serving nearly 2.5 million active and retired state and local public employees. Any increases to the employer contributions to these systems must be considered additional compensation to these employees.
Put another way, a fair way to estimate how much public employees in California are really making would be to estimate how much more needs to be contributed to their pension systems by their employers, and spread that increase among the 1,876,969 “full time equivalent” public employees. Table 9, drawn from a California Policy Center analysis performed in early 2016 using 2014 data from the U.S. Census Bureau, offers usable estimates:
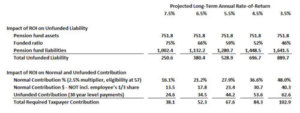
Table 9, California State/Local Pension Funds Consolidated
2014 – Est. Funding Status and Required Contributions at Various ROI
What Table 9 offers is an opportunity for the reader to pick a number. Many studies on this topic will lead with a headline proclaiming the collective unfunded liability for California’s pension funds to be $1.0 trillion, or a “half trillion.” But as can be seen on Table 9, these proclamations merely depend on what rate of return is assumed. At what remains the official rate of return projection, California’s state/local government pension funds are about $250 billion underfunded. At a projected rate of return of 3.5%, they are nearly $900 billion underfunded. The lower portion of Table 9 offers actual cash payment projections based on collective assumptions (2.5% multiplier, eligibility at 57, 30 year level payments to reduce unfunded liability) that we consider best-case conservative. As can be seen, best case, $38.1 billion needed to be contributed to the pension funds in 2014 – in reality, in that year the collective contributions were only $30 billion (ref. The Coming Public Sector Pension Apocalypse, CPC April 2016).
Some relevant recent 2015 data has been compiled by Ballotpedia, showing that during 2015 the pension systems in California received $34.1 billion in contributions from government employers and paid out $48.5 billion to retirees. While the total required taxpayer contribution calculations on Table 9 are from a previous year, it is a reasonable assumption that they will not be lowered in 2015 compared to 2014. Therefore, at a 7.5%, best case rate of return, the pension funds should have received $38.1 billion in 2015, but actually only got $34.1 billion. That is, best case, they were $4.0 billion short.
In reality it is likely they needed to contribute far more than $38.1 billion, because many pension funds, including the largest, CalPERS, have already acknowledged they will have to lower their projected return to 6.5%. And the largest municipal credit analysis bureau in the U.S., Moody’s, has begun using the risk-free corporate bond rate of return when calculating pension liabilities for cities and counties, 5.5%. One may argue that a realistic rate-of-return projection belongs lower still, at 4.5% or even 3.5%. After all, 3.8% is the rate liabilities are valued at by the pension systems themselves when calculating how much an agency that wants to exit the system has to pay them. But sticking with a reasonable 5.5%, as can be seen on Table 9, the pension funds during 2015 should have received $67.6 billion and only got $34.1 billion. They were $33.5 billion short.
Applying this shortfall pro-rata to the amount paid California’s 1.8 million full-time-equivalent active state and local government workers is straightforward. $33.5 billion / 1.8 million = $17,848.
To be perfectly accurate, this average would obviously need to be applied unevenly. For example, the more generous pay and pension formulas offered to public safety employees means it would cost more than $17,848 in additional pension fund contributions each year to keep their pension funding solvent. Conversely, other employees would be able to shore up their pension funding ratios with less than a $17,848 per capital annual increase. But on average, this is a sound number. If anything, it remains low, because unfunded OPEP (other post employment benefits, typically supplemental health insurance) liabilities also require increasing contributions during the careers of active workers who expect to receive these benefits in retirement.
Therefore we can conclude that the average pay and benefits for California’s active state and local public employees totals at least $139,691 if they expect to collect their retirement benefits without reductions. What they currently make on average, $121,843 per year, almost certainly does not include sufficient pension fund contributions to allow them to actually get the benefits they were promised. So depending on which number you pick, the average private sector worker in California, whose pay and benefits are at best estimated to be $62,475 per year, makes between 45% and 51% of what their public servants make. Can greater levels of education and job risk account for this two-to-one disparity?
* * *
Ed Ring is the vice president of policy research for the California Policy Center.
SOURCES
California’s Total State and Local Debt Totals $1.3 Trillion, 2017, California Policy Center
The Coming Public Pension Apocalypse, and What to Do About It, 2016, California Policy Center
Government Compensation in California, California State Controller
Government Employment & Payroll, U.S. Census Bureau
How Much Do California’s State, City and County Workers Really Make?, 2014, California Policy Center
California Labor Market Information, California Employment Development Dept.
Consumer Price Index Data from 1913 to 2017, U.S. Dept. of Labor
Employer Costs for Employee Compensation 1995, 2000, 2005, 2010, 2015, U.S. Dept. of Labor, Bureau of Labor Statistics
California Employment and Wages Data Tables (2011-2016), California Employment Development Dept.
California Employment and Wages Data Tables (2000-2010), California Employment Development Dept.
Public pensions in California, 2015, Ballotpedia