
1 in 5 Los Angeles County School Districts Had Major Accounting Moves in 2020
The fiscal year of July 1, 2019, to June 30, 2020, was one of the more memorable for California’s school districts. The COVID-19 pandemic would dramatically impact students in March of 2020. The Golden State had not seen anything like it since the Spanish Flu epidemic in 1918, more than a century prior. This unique worldwide event included a lockdown of public schools, thanks to an executive order from Gov. Gavin Newsom.
With the benefit of hindsight, let’s use a simple fiscal metric to determine how the school districts in Los Angeles County were initially impacted fiscally, based on their audited financial statements.
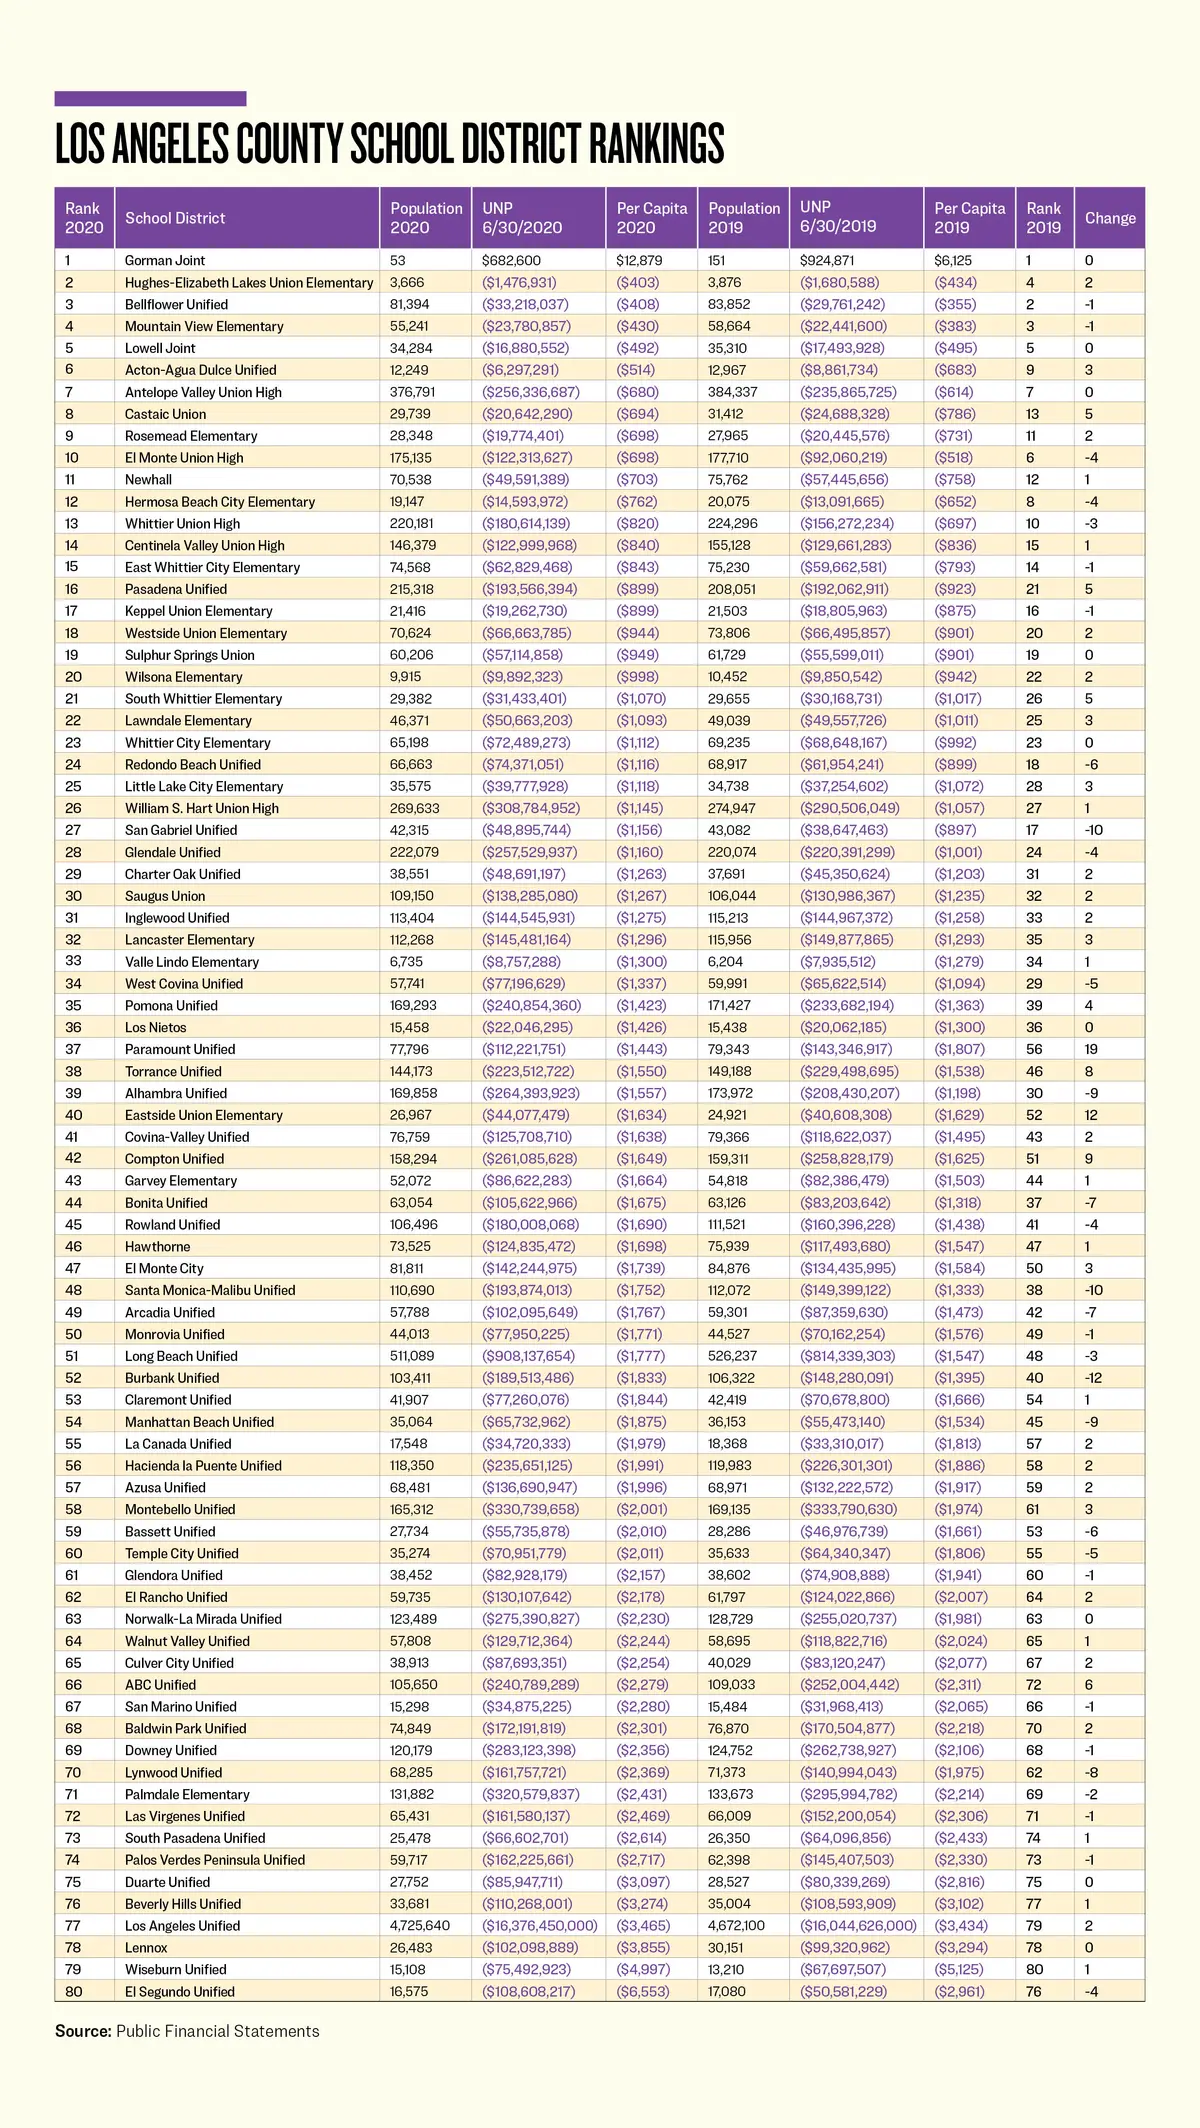
Each district has established boundaries and serves a specific population. Taking the population and dividing it into the district’s unrestricted net position, which is reflected in its basic financial statements, one arrives at a per capita with which to determine a range and to rank the districts. Those at or near the top are fiscally stronger. Those at or near the bottom will have greater fiscal stress should there be an economic recession.
For the year ending June 30, 2020, one in five districts had significant movement. Eight districts moved up five or more places, and 11 dropped that many or more places. As all but one of the districts has an unrestricted net deficit, this term will be used frequently.
The graph below provides the results. Let’s review the finances of the four biggest upward movers and the five biggest downward movers, with a bonus for this year’s last-place winner. If you reside in one of these 10 districts, it will hopefully provide the various details to help you understand the reasons for the movement.
Paramount Unified School District moved up 19 places but has an unusual story. It had expenditures in excess of revenues of $7.9 million, something that usually increases the unrestricted net deficit. It also moved $4.9 million into restricted assets, a transfer that also usually increases the unrestricted net deficit. But it reduced its net investment in capital assets by $43.9 million, something that usually happens when bonds have been issued but are not spent. Combined, the unrestricted net deficit was reduced by $31.1 million.
In reviewing the statement of net position, Paramount’s capital assets reflect no increase. And its debt from certificates of deposit and general obligation bonds had no significant increase either. Its liabilities (debt) increased for defined benefit pension costs by $12.7 million, which impacts the bottom line. But there is no mention as to why the net investment in capital assets was reduced by $43.9 million. We’ll have to wait for the audited financial statements in future years to solve the mystery, as the notes accompanying their audited financial statements are silent on this massive adjustment.
Compton Unified moved up nine places by literally standing still, as other districts dropped down below it. And Torrance Unified moved up eight places for the same reason.
On those that dropped in the rankings, San Gabriel incurred expenditures in excess of revenues of $9.2 million, explaining the bulk of the increase to its unrestricted net deficit of $10.2 million, dropping it 10 places.
Alhambra Unified has an intriguing story. Its audited financial statements for the year ending June 30, 2019, shows an unrestricted net deficit of $208,430,207 on its statement of net position. However, its introductory notes show it as $247,935,499, which is the amount the introductory notes show for this fiscal year. It looks like a step was missing when a restatement was implemented. During this fiscal year, it had expenditures exceeding revenues by $22.3 million, explaining the majority of why its unrestricted net deficit increased by $16.5 million from the $247.9 million plateau, dropping nine places.
Manhattan Beach Unified had expenditures in excess of revenues of $1.7 million, added $18.6 million to its net investment in capital assets, and moved $10 million out of restricted assets. Combined it increased the unrestricted net deficit by $10.3 million and also dropped nine places.
Santa Monica-Malibu Unified had revenues in excess of expenditures of $8.7 million, transferred $17.6 million out of restricted assets, and invested $32.7 million more in new construction over the related new debt toward its net investment in capital assets. Like Alhambra Unified, it also had a prior period adjustment. The amount was $38 million to “correct errors reported in the prior year financial statements” related mostly to its general obligation bonds. The final result was an increase in its unrestricted net deficit of $44.5 million, dropping it 10 places.
Burbank Unified had expenditures in excess of revenues of $15.4 million, transferred $6.5 million into restricted assets, increased its OPEB liabilities by $19.1 million and its pension liabilities by $5.8 million. These all factored into the $41.3 million increase in the district’s unrestricted net deficit increase, resulting in a 12-place drop.
I’ll close with the district that decided to capture last place in a big way, by doubling its unrestricted net deficit. El Segundo Unified had revenues in excess of expenditures of $7.6 million. It transferred $22.9 million into restricted assets. And it transferred $42.5 million into its net investment in capital assets, with no similar movement in capital assets or borrowings. A review of the audited financial statements shows that the net investment in capital assets mirrors the capital assets amount but does not reflect the related debt. Expect this to be cleared up in future years. Errors can and do happen, especially with the net investment in capital assets, as fund accounting is a unique niche in the accounting industry. But, we do the rankings based on the accounting provided by a municipality’s management.
The next fiscal year would be one for the memory books, as federal funding during the coronavirus pandemic would provide a unique dynamic to school district funding.
John Moorlach is the director of the CPC’s Center for Public Accountability. He has served as a California State Senator and Orange County Supervisor and Treasurer-Tax Collector.
This article originally appeared in The Epoch Times.