Fiscal Rankings for Los Angeles County’s 88 Cities Finally Available, for 2020
The city of Huntington Park, California has finally released its Annual Comprehensive Financial Report (ACFR) for the year ending June 30, 2020. The audit by external independent auditors was finally completed on Aug. 10, but was not released until Dec. 5.
Thus, Huntington Park won the race for dead last in transparency and accountability among Los Angeles County’s 88 cities and did so by some six months.
Taking second place was the city of Artesia, which presented its 2020 ACFR to its city council on April 10.
Perhaps the COVID-19 pandemic can be blamed, as the Governor’s lockdown started in the final months of this fiscal year, but that should not be a reason for the tardiness, as most of California’s 482 cities did not fall this far behind in this necessary annual fiscal reporting requirement. In the case of Huntington Park, it was shell-shocked by corruption turmoil that put a lengthy delay in its recovery process.
There is also some irony here. Artesia Councilman Ali Sajjad Taj was the President of the California League of Cities. One would think that setting a better example should start from the top. At least Artesia moved up one position in the delinquency category, as Artesia was the last to provide its 2019 ACFR, which occurred in late January of this year.
Let’s hope both cities can post an “under new management” sign and expedite the release of their 2021 and future ACFRs to get Los Angeles County’s city rankings current and accurate.
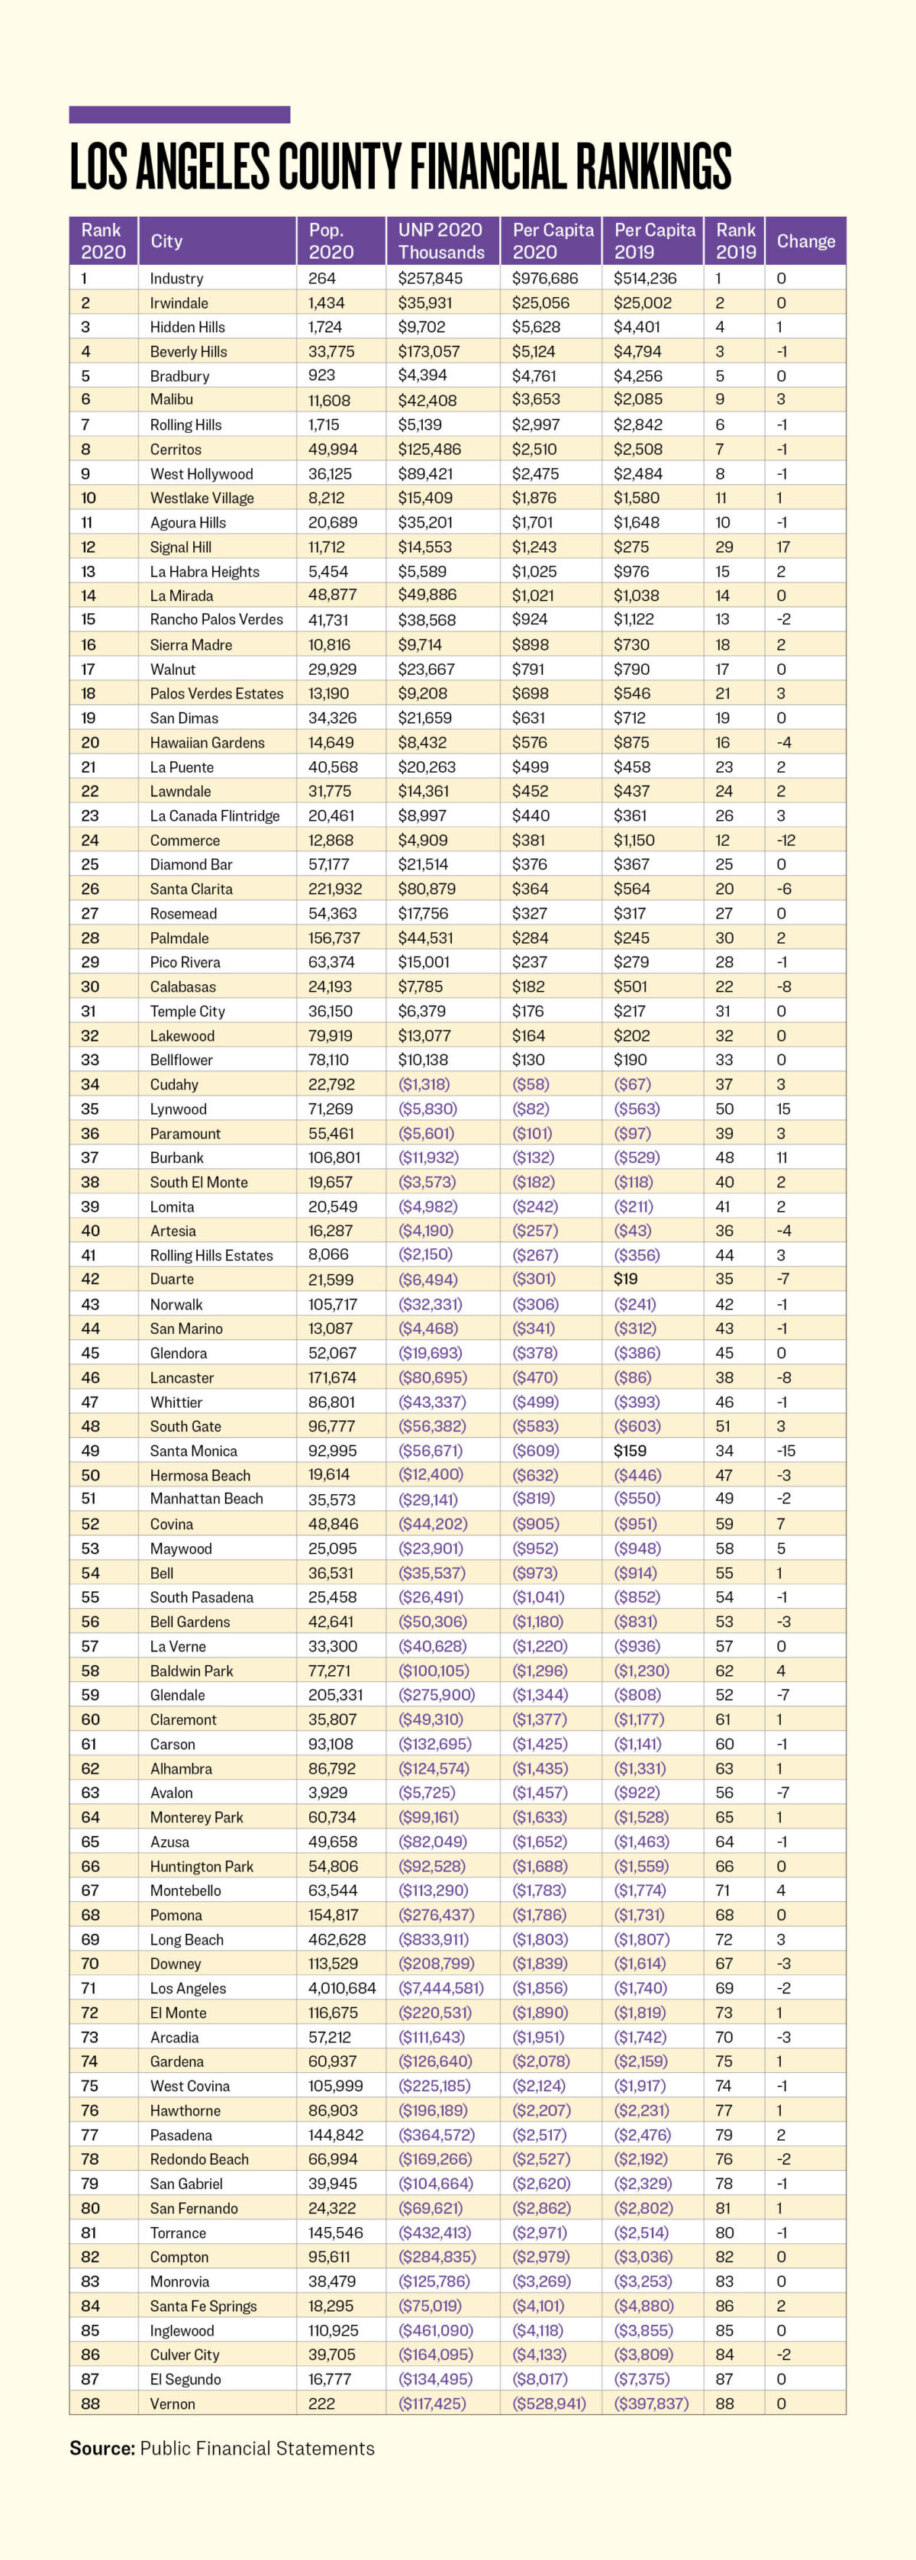
What can we learn from the graph below, showing the cities ranked according to their unrestricted net position (UNP) on a per capita basis? If the city’s finances are healthy, this number should be positive, like the first 33 cities below. If the UNP is in parentheses and in color, that means it’s negative, and the city has more debt than assets.
Which city is the best managed? Which cities are moving up the list? Which are falling? Residents would appreciate knowing they are in a fiscally well-managed city.

The first observation is the population numbers provided by each city or from reliable census data. With rising home prices and Sacramento’s micromanagement of the number of new housing units each city should now build, it’s surprising to find that the total population declined by 38,661 (0.42 percent). As California goes, so does L.A. County. People are leaving, at least they did in the twelve months ending June 30, 2020.
The second observation is movement. One dozen of the cities moved more than five positions. The other 76 cities moved up or down five or less positions. This is what we should expect, incremental movement. So how did Signal Hill move up 17 places? Lynwood 15 places? And beautiful downtown Burbank 11 places?
Starting with Signal Hill, let me provide accounting nomenclature known as “restatement.” This is where the auditing firm makes a discovery from a previous year that needs to be corrected. A city’s fixed assets, described as capital assets, rarely decrease except for depreciation or a rare sale. Signal Hill “had a net decrease in capital assets of $19.7 million … mainly due to the removal of the Los Cerritos Stormwater Channel … associated with a joint-entity project that is not owned by the City.” With a major decrease in capital assets, it resulted in a major increase in unrestricted net assets. This anomaly is a one-off event, and something rarely seen.
Let’s move on to the city of Lynwood. It reduced its restricted assets for public works projects from $23.8 million to a negative $7.6 million. The adjustment totals $31.4 million and explains the majority of the $34.4 million reduction of the city’s unrestricted net deficit. But the ACFR is silent on the justification. The lesson here is to convert previously restricted assets to improve your overall fiscal status. It moved Lynwood from 50th place to 35th, up 15 places.
The city of Burbank followed a similar strategy, reducing funds restricted for environmental (public works and community development) by $30 million, also without explanation in its ACFR. The adjustment moved the city from 48th place to 37th, up 11 places.
The following two cities made major downward movements: Santa Monica, 15 places, and Commerce, 12 places. Santa Monica’s post-employment benefit and pension liabilities increased by $16.7 million, while claims payable increased by $32.3 million, explaining two-thirds of the city’s $71.4 million drop in its unrestricted net position. The remainder can probably be explained by an increase in the net investment in capital assets of $26.2 million.
The city of Commerce reported an $8.7 million increase in its post-employment benefit and pension liabilities, explaining 87 percent of its reduction in unrestricted net assets, which the two obligations now represent 80 percent of the city’s total liabilities.
Other than the exceptions above, the majority of cities seemed to hold their positions well at the onset of the pandemic. Once we receive the ACFRs for the year ending June 30, 2021, we can do an analysis on how L.A. County’s cities held up with the loss of business activity counter-balanced with COVID-related federal funding grants.
If your city is in the top half of the chart, encourage your city council members to stay the course. If your city is in the bottom half, it’s time to encourage your city council to formalize a financial strategy to prepare for the upcoming predicted recession.
John Moorlach is the director of the CPC’s Center for Public Accountability. He has served as a California State Senator and Orange County Supervisor and Treasurer-Tax Collector. This article originally appeared in The Epoch Times.
