Which Bay Area Cities Need to Improve Their Fiscal Status?
The state of California has 58 counties and 482 cities. To provide manageable fiscal rankings, I’ve divided the state into eight regions, closely following the districts established by Caltrans.
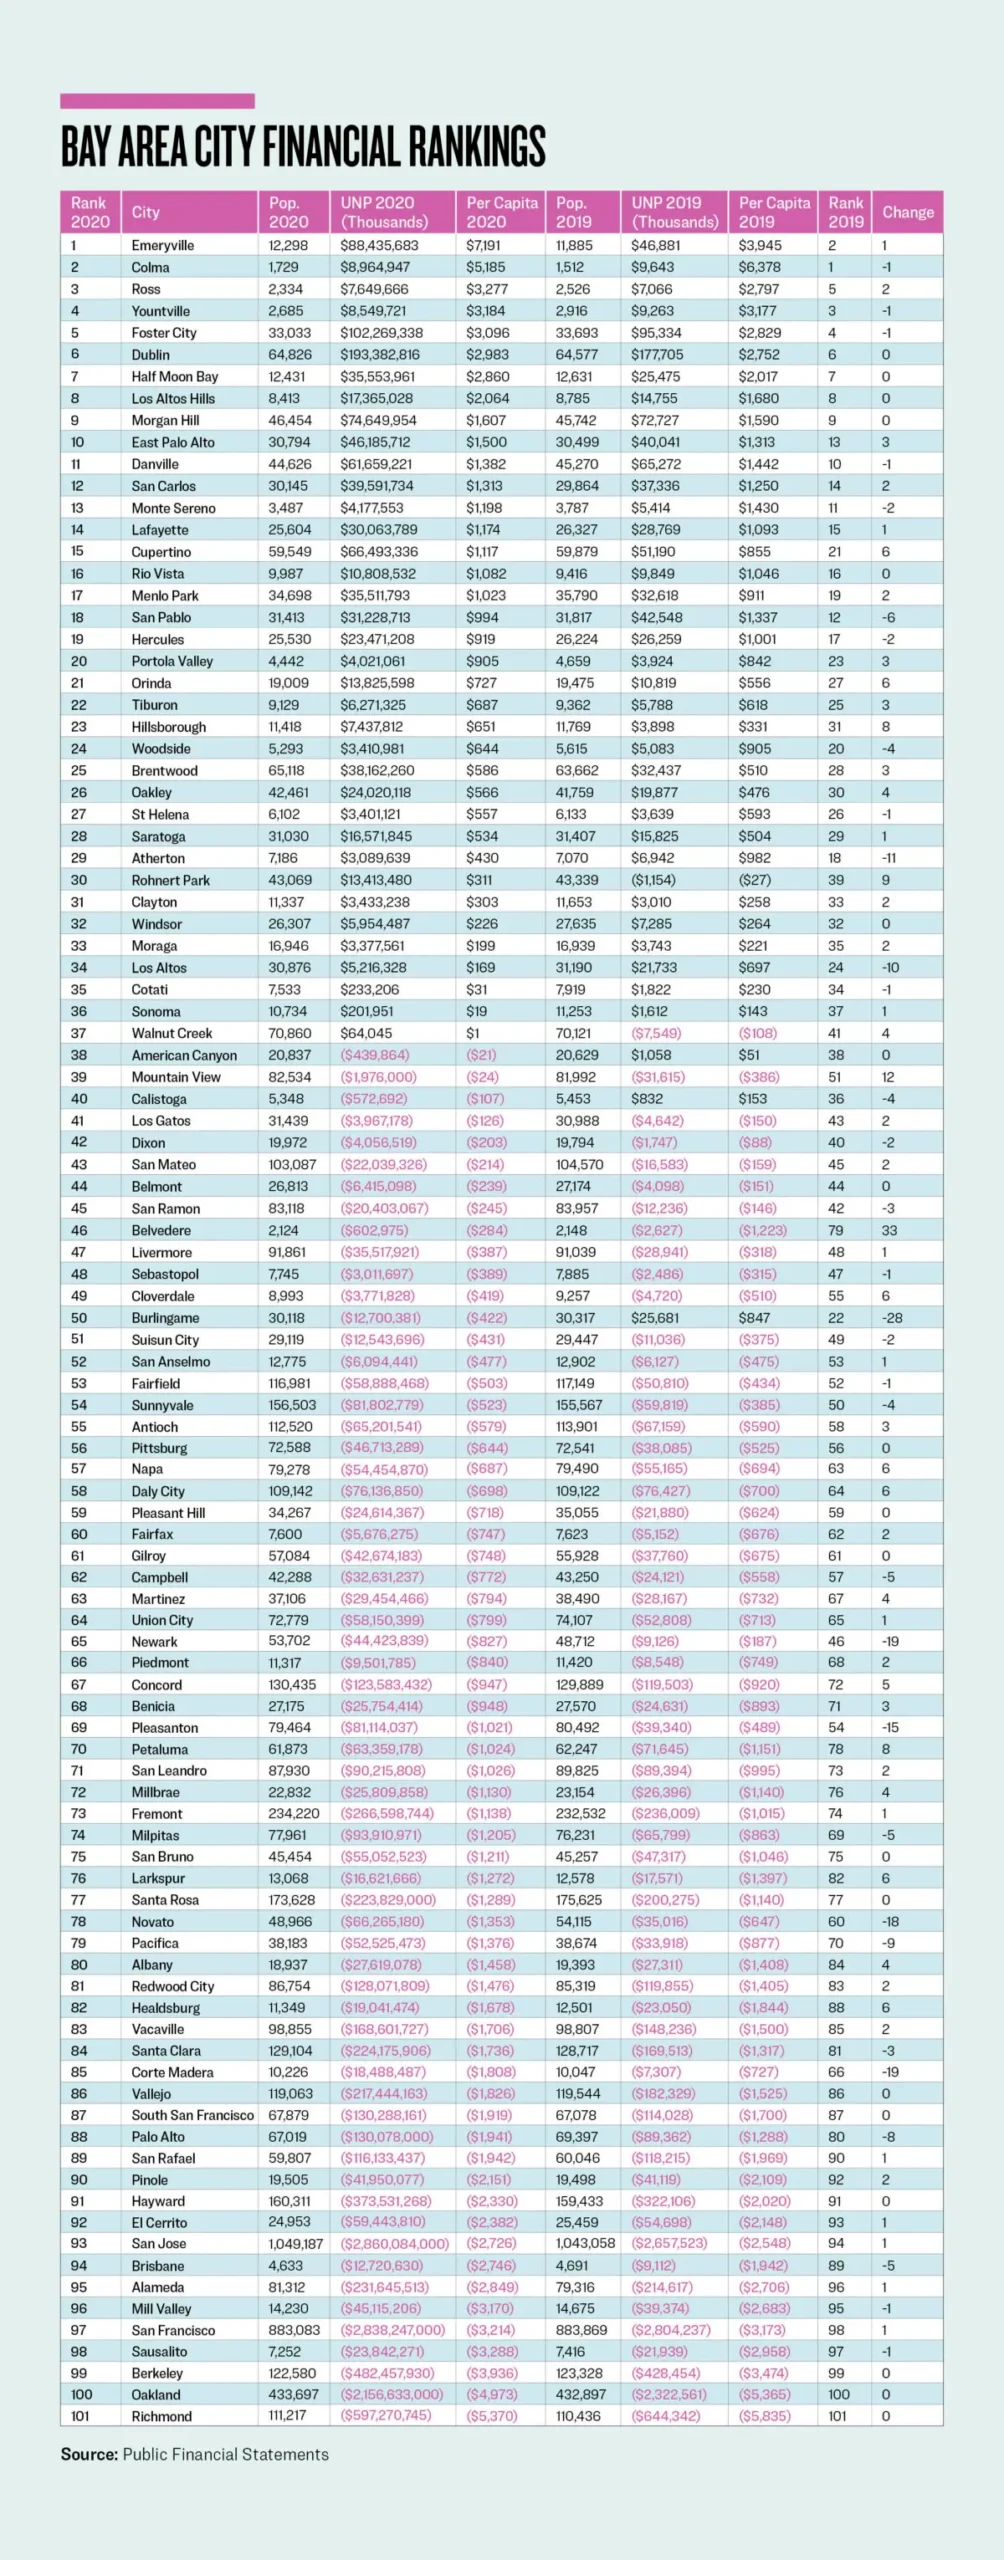
The Bay Area, Caltrans District 4, has 101 cities. The rankings for 2020 are compared to those of 2019 in the graph below. For an explanation of the 2019 rankings, please see “Largest Bay Area Cities Rank Poorly on Financial Health” from Oct. 19, 2023.
The methodology is rather simple. In reviewing the annual comprehensive financial reports for every city, I take their unrestricted net position for governmental activities and divide it by the city’s population. This provides a per capita and generates a range. Ideally, cities should have a positive per capita. But due to taking on generous defined benefit pension and retiree medical plans, nearly two-thirds are in negative territory.
The goal of each city should be to have more assets than liabilities, so upward movement in the annual rankings would be helpful.

Over the past few years, the coronavirus has impacted municipalities dramatically, mostly in a positive way. This is attributed to the massive influx of federal dollars to the local level. But, for the fiscal year ending June 30, 2020, the pandemic shut down by Gov. Gavin Newsom started to take effect in the last quarter of the year. Most of the cities held their own, with nearly sixty percent holding their ranking or moving less than three places.
Nearly one in five of the cities remained in the same position. Fifty moved up and close to a third dropped in the rankings. Showing some interesting movement, 20 cities moved 3 to 5 places, with 14 moving between 5 and 10 places. But 8 moved more than 10 places, six down and two up, for which we’ll take a closer look.
One factor to keep in the back of your mind is the population of the cities. Those with lower numbers will be impacted by a change of $1 million, while this will be unnoticeable for major metropolitan cities.
Another factor to observe is that the cities with the strongest and weakest balance sheets seem to stay in place, while most of the movement seems to be in the middle of the pack.
The cities that dropped significantly in 2020 did so by converting unrestricted assets to restricted, mainly for some future purpose, thus reducing the unrestricted net assets. Each city had different reasons for setting aside significant sums.
The double-digit city is Burlingame, which had revenues in excess of expenditures of $18.4 million, but still increased its unrestricted net deficit by $38.4 million, dropping it 28 places. It did so by increasing restricted assets by $48.2 million, which explains 85 percent of the movement in the wrong direction.
The city of Corte Madera increased its restricted assets by $9.4 million, explaining the increase of $11.2 million in its unrestricted net deficit. This caused Corte Madera to drop 19 places. The city of Newark restricted $58.4 million, creating a $57.1 million increase in its unrestricted net deficit and dropping 19 places in the rankings.
The city of Novato increased its unrestricted net deficit by $9.4 million, with the bulk coming from a $2.9 million increase in its restricted assets and $3.9 million from an increase in its pension liability. The net result caused this city to drop 18 places.
The city of Pleasanton also decided to restrict $46 million during the year and increased its unrestricted net deficit by $41.7 million, dropping it 15 places in the rankings.
The city of Atherton built a new town center, expending a net of $12 million, and benefited from $9 million in revenues in excess of expenditures, netting $3 million. This may explain why this small city’s unrestricted net assets dropped by $3.9 million and its ranking fell by 11 places.
Let’s look at the cities that had major upward movement. Belvedere enjoyed revenues in excess of expenditures of $1.8 million, 31 percent more than needed. For a city with only 2,148 people, this had a significant impact on the balance sheet. While only reducing its unrestricted net deficit by $2 million, it jumped up 33 places on a per capita basis.
The city of Mountain View enjoyed revenues in excess of expenditures of $84 million, allowing it to reduce its unrestricted net deficit by nearly $30 million and jump up 12 positions.
The state of California still has to issue its annual comprehensive financial report for the year ending June 30, 2022. It used to be the state of Illinois that was tardy. Now it’s California, and the Golden State is taking lateness to a whole new and embarrassing level. It’s 14 months later than most of the 49 other states.
Ten of the state’s counties are also delinquent in issuing their basic financial statements for the same fiscal year. So much for a commitment to transparency.
As certain municipalities attempt to get current, we’ll provide additional rankings and, hopefully, also become current. At least this retired Certified Public Accountant who performed audits can only hope.
This article originally appeared in The Epoch Times.
John Moorlach is the director of the CPC’s Center for Public Accountability. He has served as a California State Senator and Orange County Supervisor and Treasurer-Tax Collector.
