California’s Total State and Local Debt Totals $1.3 Trillion
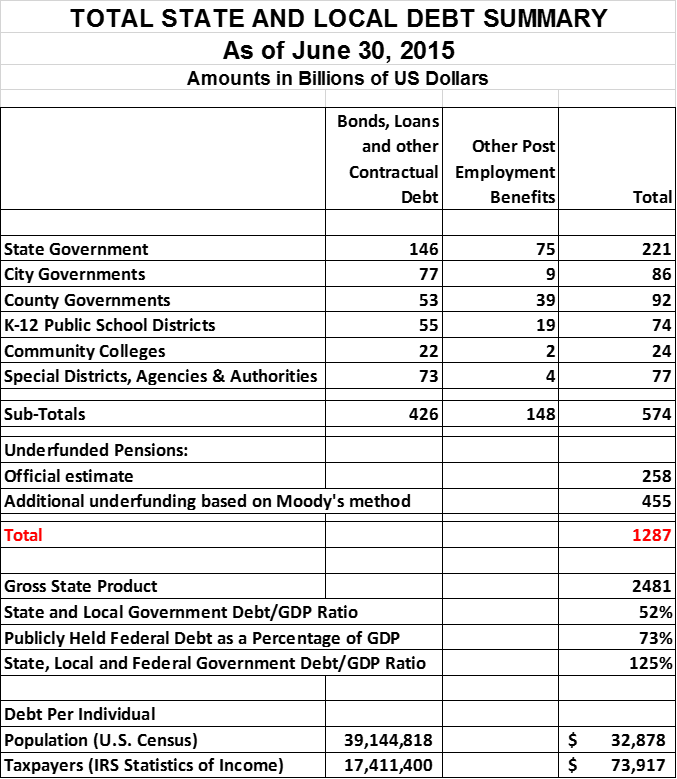
We estimate that California state and local governments owe $1.3 trillion as of June 30, 2015. Our analysis is based on a review of federal, state and local financial disclosures. The total includes bonds, loans and other debt instruments as well as unfunded pension and other post-employment benefits promised to public sector employees. Our estimate of California government debt represents about 52% of California’s Gross State Product of $2.48 trillion. When added to the state’s share of the national debt, we find that California taxpayers are shouldering debt burdens on a par with residents of peripheral Eurozone states.
Not included are billions of dollars in deferred maintenance and upgrades to California’s infrastructure. To the extent California’s government has not maintained investment in infrastructure maintenance and upgrades to keep up with normal wear and to keep pace with an expanding population, it has passed this cost on to future generations who will have to issue additional debt to pay for this expense.
Components of California Government Debt
This is an update of a 2013 California Policy Center study entitled “Calculating California’s Total State and Local Government Debt.” That study reported total debt between $848 billion and $1.1 trillion. While we retain confidence in the findings of this earlier analysis, our new estimate incorporates a more comprehensive array of data sources and updated methodologies.
Our previous research relied primarily on official reports prepared by the State Controller and State Treasurer. Since 2013, some of this reporting has been altered or discontinued. Our current estimate supplements state provided data, with US Census data and information gathered from audited financial statements issued by state and local governments.
The latest U.S. Census Bureau estimate of California state and local government debt is $426 billion. Although this estimate is as of 2014, it is the most authoritative number available. Further, it appears to be reasonable based on our review of audited financial statements published by 300 of the state’s largest governmental entities. Although the state has over 4,000 government entities (and perhaps many more depending on one’s method of counting), most of these entities are relatively small and do not contribute significantly to state-wide totals.
We used the data collected from the audited financial statements to allocate the $426 billion total to the various categories of governments listed in the first section of the following table. State government is the largest borrower, but cities, counties, local educational authorities and special purpose governments also made large contributions to the total.

Special districts, authorities and agencies receive relatively limited attention, but some are large borrowers. For example, the Metropolitan Transportation Commission responsible for Bay Area Bridges, and to a lesser extent, area roads and public transit systems, has over $10 billion in liabilities, mostly in the form of bonds.
Table 1 also shows an estimated $148 billion of unfunded Other Post-Employment Benefits (primarily retiree health care). The state and county governments contribute the lion’s share of this total. Los Angeles County has the largest Unfunded Actuarially Accrued Liability (OPEB), at almost $27 billion. Our OPEB UAAL estimates are based on our review of the government audited financial statements for the 300 largest state government entities, which we believe account for 95% of statewide obligations.
The bond and OPEB obligations account for a total of $574 billion that we can attribute to governments by category. To this we add statewide unfunded pension obligations reported by 85 single and multi-employer pension plans, estimated at $258 billion. For most systems, we used a database posted by the State Controller, but for the largest systems, we obtained 2015 updated data from actuarial valuation reports.
Unfunded retirement obligations are considered long-term debt by any reasonable accounting standard. The principle behind this is clear: retirement benefits are earned during the years an employee works. To the extent the pension fund assets do not equal the present value of this future liability, a debt is created.
A large body of literature has arisen to question Unfunded Actuarially Accrued Liabilities (UAAL) reported by pension systems (see, for example, the work of Robert Novy-Marx and Joshua Rauh). The main concern is that most public pension systems discount the value of future benefit payments by unrealistically high rates of between 7% and 8% per year. Some authors contend that the discount rate employed should be a long-term risk free rate (of around 3%) because the benefits are almost certain to be paid. Others argue that a discount rate based on future asset returns may be used, but argue for adopting a more conservative rate given the fact that most systems have failed to achieve target returns in most recent years.
Moody’s, the credit rating agency, discounts pension liabilities with the Citigroup Pension Liability Index (CPLI), which is based on high grade corporate bond yields. When Moody’s first introduced its pension methodology a few years ago, we applied it to pension liabilities reported as of June 2011 when CPLI was 5.67%. More recently, CPLI has fallen: in June 2015, it was 4.44%. As a result, the increase in UAAL arising from the use of Moody’s methodology is much greater than it was when we first evaluated pension debts.
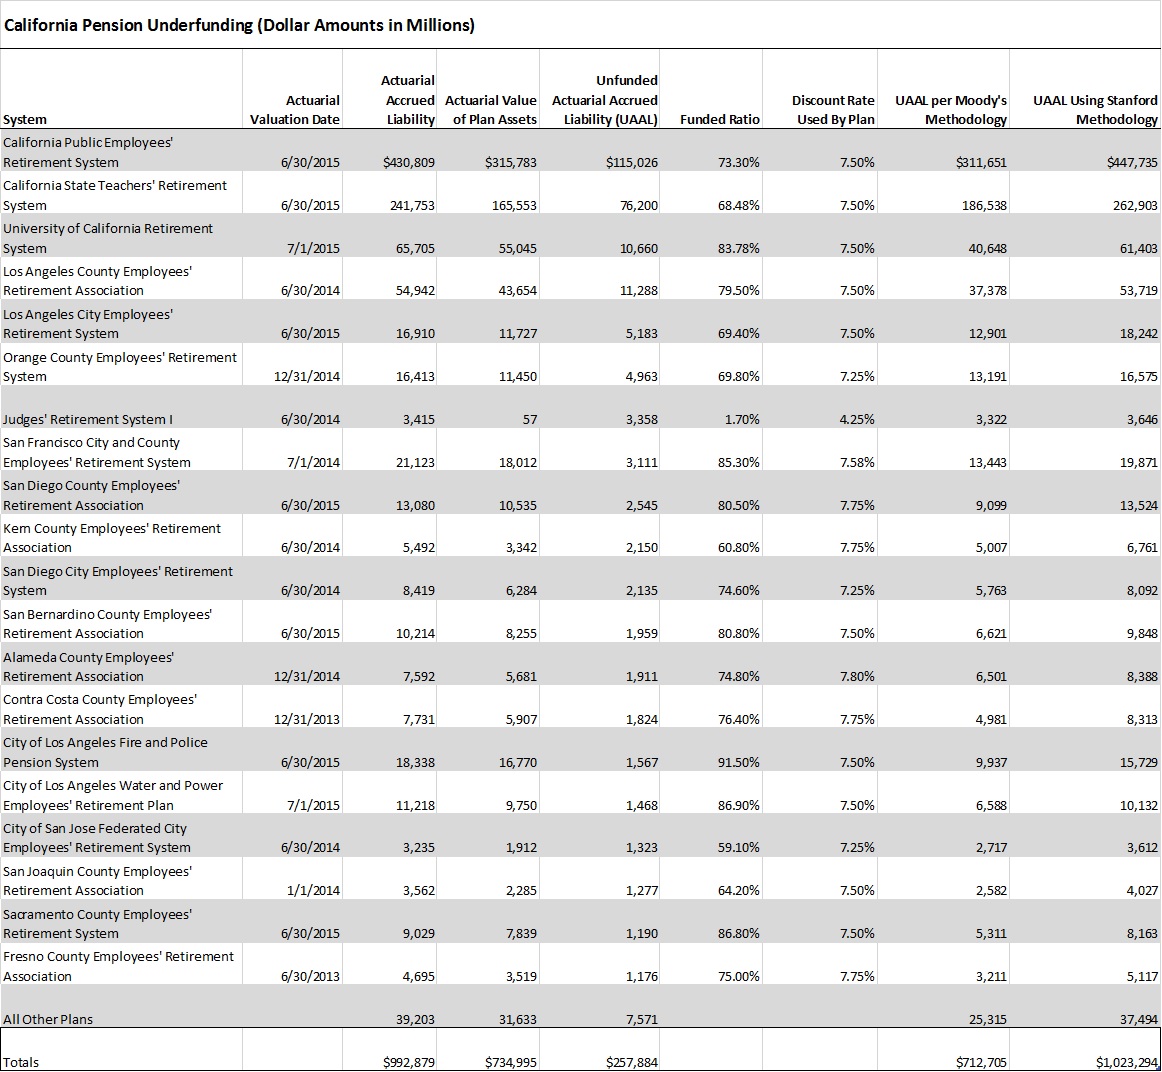
Using the CPLI discount rate, we estimate that the real UAAL is $713 billion, which is $455 billion more than the officially reported (the method for restating UAAL based on a different discount rate assumption is described here). An alternative approach used by the Stanford Institute for Economic Policy Research (SIEPR) is to discount the liabilities by a rate closer to the risk-free rate. In a recent report, Stanford researchers used a discount rate of 3.723%. Using Stanford’s methodology, we estimate a UAAL of $1.02 trillion.
It should be noted that this low rate is used by CalPERS to determine how much to charge a local government that chooses to leave the system. The logic in using this rate is probably that CalPERS would no longer be able to raise pension contribution levels after the agency has left the system and can’t depend upon local taxpayers to make up any shortfall in CalPERS’ future investment performance.
The following table shows liabilities by major pension system as reported, with the Moody’s adjustments and with the Stanford adjustments.

Debt Continues to Increase
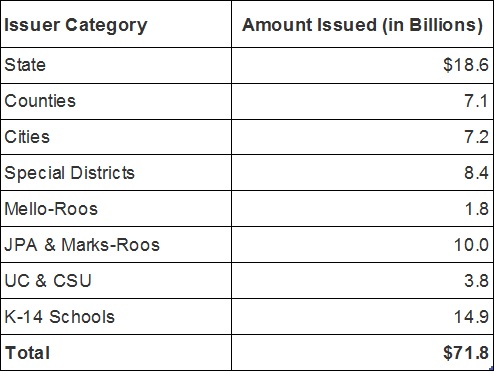
According to the State Treasurer’s Office Debt Watch website, $72 billion on new debt was issued in the year ending December 2016 as summarized below. This amounts to a debt increase of about $1,800 per citizen or about $4,600 per taxpayer in only one year (but this is partially offset by maturities and early repayments of exiting issues).

California Debt in a National and International Context
The grand total of government borrowings, unfunded OPEB obligations and unfunded pension obligations is $1.28 trillion, or 52% of Gross State Product (GSP is a state’s share of the nation’s Gross Domestic Product and was $2.48 trillion in 2015). This represents a significant but not extraordinary debt burden by international standards.
But to more properly consider California debt in an international context, we should add federal debt for which California taxpayers may be responsible. In 2015, the ratio of publicly held federal debt to GDP was 73% (the national debt, which also includies debt securities held by the Social Security Administration and other federal agencies raises this proportion to 101% as of mid-2015).
Combining California’s debt with publicly held federal debt, we estimate a total debt-to-GDP ratio of 125% (or 153% using the broader definition of federal debt). This level places California distressingly close to peripheral Eurozone countries that faced financial crises in 2011 and 2012. Portugal’s 2015 debt-to-GDP ratio was 129% and Italy’s was 133%.
Implications at the Individual Level
The estimated California government debt of $1.3 trillion can be allocated back to all residents or just those that pay taxes. The state’s population is about 39 million. According to the IRS, about 17 million individual tax returns were filed in 2014. These levels imply California government debt burdens of $33,000 per resident and $74,000 per taxpayer – excluding their share of federal debt.
Further Research Needed
There are additional questions that remain to be addressed. The totals we report do not include the cost of addressing deferred maintenance of the state’s civil infrastructure. However, in 2015, California Forward estimated that the state faces a $358 billion infrastructure funding gap over the next ten years.
We have not looked at trends. How much faster has state and local debt grown compared to the state’s economy that supports the debt? We have not made any attempt to determine if the level of debt is beyond what the state can afford to service or what the impact of future interest rate increases may have on the ability of state and local government entities to service this level of debt in the future. Interest rates are at historic lows and are likely to rise in the future.
We have not estimated the impact of any possible increase in required pension payments on state and local government budgets. If CalPERS and other public employee pension systems reduce their discount rates to be consistent with recent investment performance and likely future investment returns, pension payments will increase substantially for state and local governments.
The State Treasurer’s office reports totals for debt issued on their Debt Watch website but does not estimate total debt outstanding. Some of the debt issued is retired or replaced by new debt. We understand that starting in 2018 the State Treasurer will start reporting debt outstanding as well as debt issued by various levels of government. This should improve the accuracy of future California Policy Center reports on total debt outstanding and eliminate the need to make estimates for some of the data.
About the Authors:
William Fletcher is a business executive with interests in public finance and national security. He retired as Senior Vice President at Rockwell International where most of his career was spent on international operations and business development for Rockwell Automation. Before joining Rockwell, he worked for Bechtel Corporation, McKinsey and Company, Inc., and Combustion Engineering’s Nuclear Power Division, and was an officer and engineer in the U.S. Navy’s nuclear program. His international experience includes expatriate assignments in Hong Kong, Europe, the Middle East, Africa and Canada. In addition to his interest in California’s finances, he is involved in organizations dealing with national security and international relations. Fletcher is a graduate of Tufts University with a BS degree in Engineering and a BA degree in Government. He also graduated from the U.S. Navy’s Bettis Reactor Engineering School.
Marc Joffe is the Director of Policy Research at the California Policy Center. In 2011, Joffe founded Public Sector Credit Solutions to educate policymakers, investors and citizens about government credit risk. His research has been published by the California State Treasurer’s Office, the Mercatus Center at George Mason University, the Reason Foundation, the Haas Institute for a Fair and Inclusive Society at UC Berkeley and the Macdonald-Laurier Institute among others. He is also a regular contributor to The Fiscal Times. Prior to starting PSCS, Marc was a Senior Director at Moody’s Analytics. He has an MBA from New York University and an MPA from San Francisco State University.
