Black Swans and Super Bubbles
Black Swan: an unpredictable event that is beyond what is normally expected of a situation and has potentially severe consequences.”
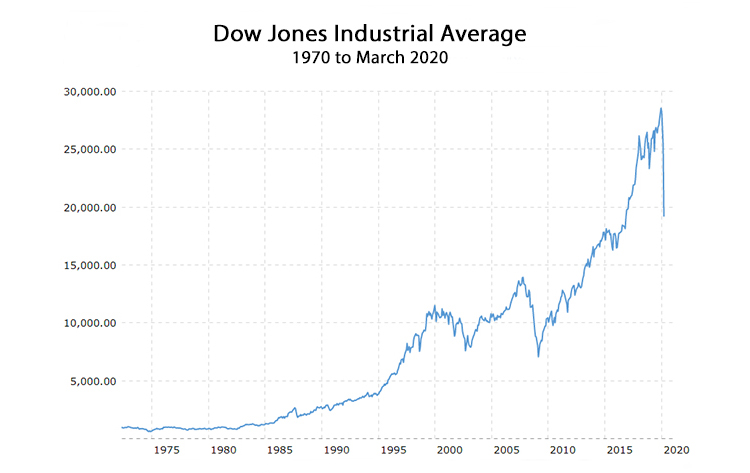
For decades there have been so-called “permabears” claiming that investment returns in the stock market were unsustainable. When the internet bubble popped in 1999, the permabears felt vindicated. But then, starting around 2003, the bulls came back. In 2009, the housing bubble popped and the permabears were vindicated once again. But then the bulls came back with a vengeance, going on an 11-year rampage during which the value of the Dow Jones Industrial Average rose from a low of 6,627 on March 2, 2009 to a dizzying height of 29,398 on February 10.
In 10 years, 11 months, and nine days, the Dow more than quadrupled.
If an investor put their savings into the stock market back in early March, 2009, and sold it in early February 2020, he would have realized an annual return of over 14 percent. The chart below shows the value of the Dow since 1970. It is not a logarithmic scale, so the grade of the slope indicates absolute changes. So why is it that the value of the Dow displayed almost no growth between 1970 and 1985, then embarked on a roller coaster ride heading mostly up?

Whenever delving into the dismal science of economics, it’s important to acknowledge that nobody, regardless of their credentials, has a crystal ball. And when it comes to discussing the big variables, primary causes, and optimal solutions, there is no consensus.
But with stock values correcting yet again, the permabears need to be heard. It isn’t just stock values that are at risk. The bubble this time has been dubbed the “super bubble,” incorporating not only stocks, but bonds and real estate as well. To understand why permabears make this argument, the historical interest rate trends since 1970 are illuminating.
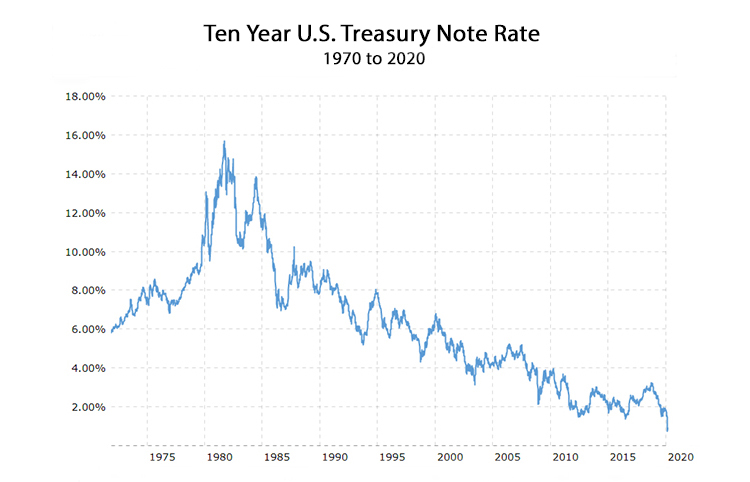
The next chart shows the 10-year U.S. Treasury note rate over the past 50 years. The first thing to notice is the inverse relationship between the T-note rate and the growth trends in the DJIA. As the rate for T-notes fell, the value of the Dow rose. The relationship between index rates and the value of stock equities makes intuitive sense. When fixed-income T-notes and bonds are paying high rates of return, there is less demand for stocks. Also supporting this inverse relationship between interest rates and the value of stocks is the fact that when interest rates are low, more borrowing occurs, which stimulates consumer spending and corporate profits, raising the value of their stock.
Theories aside, whenever the stock market was falling, interest rates were lowered in order to stimulate growth and restore the bull market in stocks, and whenever the stock market was getting overheated (“irrational exuberance”), interest rates were raised which would slow the growth in stock values.
When the internet bubble driven stock market peaked, helping drive the Dow up to 11,723 by January 2000, 10-year T-notes were paying 6.7 percent. But as the stocks fell, so did interest rates. The Dow bottomed out at 7,740 in September 2002, with the trough for the 10-year T-note shortly thereafter in January 2003 at 3.3 percent. Then as stock values rose, Treasury rates rose as well. When the real estate bubble popped in October 2007, the 10 year T-note was back up to 5.2 percent. But the Great Recession decimated the stock market, and threatened to crash the entire economy.
In moves to stimulate the economy during this extraordinary time, the 10-year T-note hit a low of 2.1 percent by December 2008. But then something strange happened. The interest rate of the T-note never fully bounced back. The highest it ever got, during this most recent 11-year bull market in stocks was 3.2 percent in October 2018. And when the DJIA hit its all time high this past February, the 10-year T-note was already down—way down—at 1.5 percent.

This fact, that interest rates were at an all time low when the stock indexes were at all time highs, makes this correction in stock values different from the two most recent previous corrections. It means that interest rates were still being lowered in order to stimulate economic growth even when the stock indexes were increasing. It means that this time, the most easily applied and reliable tool to stimulate economic growth, lowering interest rates, is not an option. It is the reason the permabears have referred to this most recent investment bubble as the “super bubble.”
“Super bubble” refers to the belief that not just stocks are overvalued, but also bonds and real estate. The reason bonds are considered overvalued is related directly to interest rates, as set by the Federal Reserve and the U.S. Treasury. When current debt is issued at a lower fixed rate of interest, then debt that was issued in the past at higher rates increases in value. This is because on the open market for bonds, any bond paying a higher rate will fetch a higher price, until whatever fixed amount the bond pays in interest matches the current interest rate.
For example, a 10-year T-note purchased for $10,000 in October 2018 was paying 3.2 percent, or $320 per year. But once interest rates fell to 1.5 percent in February, the October 2018 T-note only had to pay $150 per year to trade at a competitive rate. Since the rate is fixed, however, the price rises instead. All of a sudden this $10,000 T-note paying $320 per year is theoretically worth $21,000, because 320 divided by 21,000 equals 1.5 percent. While this explanation is a gross oversimplification, the causal relationship between interest rates and bond prices is indisputable. When interest rates fall, there is a rally in bond prices. Bonds, along with stocks, have been great investments over the past few years, but how can they possibly continue to appreciate?
The 10-year Treasury note is currently paying 0.5 percent interest, and the previously referenced pricing equations are now yielding absurd results. The market for bonds is freezing up, with pricing models entering uncharted territory. One thing is certain, the bond bubble, along with the stock bubble, has popped.
Which brings us to real estate, the third major asset class that the permabears allege has entered bubble territory. Unlike stocks and bonds, real estate is a tangible asset. While real estate isn’t finite, since the square-foot inventory of real estate perpetually increases, there are practical, physical limits on the growth or shrinkage of real estate inventory that, at least compared to stocks and bonds, puts a floor on how far its value can crash. But real estate still obeys the same law of leverage; when falling interest rates lower the cost of money, more borrowers increase the demand and prices rise.
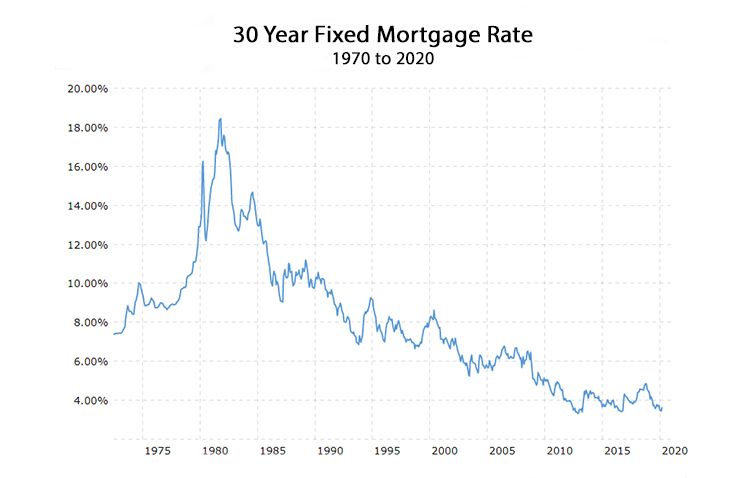
As can be seen on the next chart, however, when it comes to the 30-year fixed mortgage rate, we’re back to those “lifetime lows” that preceded the last crash in real estate values in 2008. As an investment, it is likely that real estate values will continue to hold in the U.S. markets where there is global demand from foreign investors—the California coast, New York City, Miami. U.S. real estate in general will benefit from foreign investment—assuming it is not restricted—as foreign capital seeks the relative stability of owning property in the United States. But broad American consumer demand for real estate requires Americans to retain a capacity for borrowing, a capacity which can no longer be expanded by lowering mortgage lending rates. They are about as low as they can go.

What does it mean when asset portfolios can no longer offer returns that interest investors? What happens when the value of stocks and bonds fall by trillions of dollars overnight? These questions, urgent enough on their own, are compounded by the fact that while the super bubble only required a pin-prick to pop, the COVID-19 recession is more analogous to a wrecking ball than a pin. What’s going to happen?
For about 40 years, America’s economic growth has been stimulated by gradually lowering interest rates and increasing debt. How much debt can a nation handle? How does the burden of interest payments impact the ability of businesses to pay their operating costs and the ability of consumers to engage in ongoing borrowing and spending?
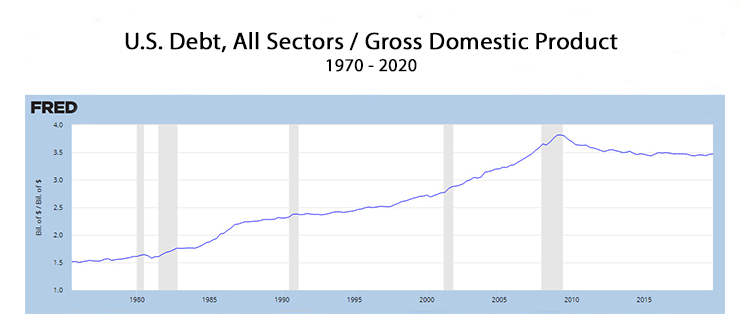
A good way to measure the ability of a national economy to handle their debt burden is to look at all debt—public and private—and compare that to GDP. The next table shows that relationship.

It’s difficult to overstate the importance of this relationship, because the ability of a nation to borrow depends on its income, just as an individual consumer’s ability to borrow depends on their income. As GDP grows, borrowing capacity grows. As shown above, while U.S. GDP has surely grown over the past 50 years, the amount borrowed has grown faster. Back in 1980, total borrowing in the United State was only 1.5 times GDP. This would be comparable to a person back then earning $50,000 per year, and owing a total of $75,000 for their home mortgage, automobiles, and whatever else they’d bought on credit. That’s not an alarming ratio.
The trillion-dollar question today is what is an alarming ratio?
What’s interesting is that the most recent ratio reported by the Federal Reserve, with total debt about 3.5 times GDP, is actually down from a high of nearly four times GDP in 2009. With the value of all debt in the United States currently at $75.5 trillion, over a reported 2019 GDP of 21.4 trillion, this suggests it would be possible to issue up to $10 trillion of new debt merely to reach the 4.0 ratio of debt-to-GDP we nearly reached a decade ago.
Once you accept the heretical notion that all debt is equal, that it doesn’t matter which balance sheet holds the debt, then you might consider the vitality of the U.S. economy as if it were a household. Can a household with an income of $50,000 manage a debt of $200,000? Yes. Easily. But there’s much more to this story.
The Primacy of Collateral
As in 2008, the Federal Reserve right now is preparing to purchase debt by issuing credits to banks and other creditors. This time, however, the Federal Reserve intends not only to purchase U.S. Treasuries and government-backed mortgages but also private debt. The goal is to stabilize the bond market and other financial markets, fund government payments to citizens and businesses that have been sidelined indefinitely by the COVID-19 pandemic. This explains where the federal government is getting $2 trillion to spread immediately into the economy.
The ability of the Federal Reserve to print money, along with fractional reserve lending and federal budget deficits, are all practices that invite condemnation from fiscal conservatives. Debating whether enhanced liquidity, investment, and economic growth is worth enduring the inherent risk of these financial innovations is a fascinating exercise. It’s also futile, because they’re here to stay. And what fuels financial innovation, the engine of liquidity, is collateral.
The collateral of the United States is incalculable, but there are abundant clues. According to the Federal Reserve’s most recent Financial Accounts Report, the total value of all financial assets in the United States in 2018 was $244 trillion. This certainly doesn’t include everything of value in the nation, and with that, it’s useful to consider the collateral of the United States as compared to that of any other nation.
Step way back for a moment and imagine if a fleet of extraterrestrial investors swept into earth orbit and decided to buy the planet. Imagine they negotiated with each national government, paying them all in some intergalactic currency. How would the inherent value of everything in the United States—land, natural resources, universities and hospitals, intellectual property and infrastructure, everything—compare to similar assessments made in other nations? It’s a safe bet that America’s collateral would fare quite favorably in such an appraisal.
There is a sound argument that balance sheets for the various sectors of the U.S. economy can be linked. Shifting debt from consumers and banks to the government, and from the government to the Federal Reserve, doesn’t change the overall national economic health. One cannot reference the consolidated total debt awash in the U.S. economy, $75.5 trillion, in all sectors, without considering the total value of the U.S. economy, easily in excess of $244 trillion. That is not an unhealthy ratio.
The current decision by the Federal Reserve to create as much money as it wishes in order to protect the government, financial, commercial and consumer sectors of the U.S. economy from going into deflationary default is logical and necessary, even if it may be heretical to fiscal conservatives.
The U.S. economy right now, and the global economy, exists on a razor’s edge between inflation and deflation. Of the two, deflation would be far more catastrophic, because deflation would reduce income and inflate the real value of debt. Deflation would make it impossible for debtors to pay their interest, putting them in default, crushing demand, bankrupting creditors at the same time, and collapsing national collateral. It must be avoided at all costs.
If You’re to Spend Money You Don’t Have, At Least Spend Wisely
America’s ability to print money isn’t unique. Every currency union in the world relies on what the purists derisively refer to as “fiat money.” Nations concoct currency out of thin air, turning it into either printed notes, or electronic transfers. Currencies are no longer backed by precious metal or any other commodity. Their value is based on the willingness of buyers and sellers to trade those currencies for other currencies, and at what rate of exchange. This is how money moves in the world, and despite the enthusiasm for cryptocurrencies or the perennial warnings from the gold bugs, it isn’t going to change anytime soon.
For this reason, America’s currency remains likely to stay strong despite the decision of the Federal Reserve to inject $10 trillion, or even $20 trillion, into the U.S. economy. The Federal Reserve has even offered to inject U.S. dollar liquidity into foreign central banks, in a move that will help their liquidity at the same time as it further solidifies the position of the U.S. dollar as the global transaction and reserve currency.
Skeptics should ask themselves how exactly will the U.S. currency devalue versus other currencies, and if so, how would that harm the U.S. economy? The debt-to-GDP ratio of China, America’s emerging competitor, is now 300 percent of their GDP, comparable to that of the United States. It is unlikely, however, that China’s debt-to-collateral ratio is as healthy as ours.
China, for all its dynamism, is a thin pan on a hot fire. In the long run they face demographic collapse, political instability, and dependence on imported fuel. Their cultural soft power is poor and getting worse. Nobody wants to live in a world dominated by the Chinese regime—not even the Chinese! As for the European Union, much like the Chinese the Europeans face demographic stagnation, political instability, and require imported fuel. There are no other economies big enough to muster a currency even remotely competitive with the dollar.
National collateral is not just physical and financial assets—it is the cultural vitality and political coherence and demographic resilience of a population. This intangible collateral influences the value of a currency as much as the physical collateral, and in this intangible category, America has collateral to burn. No other nation even comes close.
And if the dollar did devalue, so what? Americans would have to import less and export more. Jobs would be created. Investment would refocus within America’s borders. Wages would rise commensurate with prices. What exactly is the downside of a weaker dollar?
In the long run, though, critics have a point. What America’s Federal Reserve has been doing, and is now doing more than ever, is the most impudent application of Modern Monetary Theory in the history of the world. The only way it can be sustained is if genuine economic growth consistently exceeds the growth of debt. Forever. This is not a certainty, even in the short run.
How long the Black Swan in the form of COVID-19 remains perched on our economic doorstep is an open question. How soon it flies away will determine how soon economic growth can resume.
In the long run, what guarantees GDP growth is not financial engineering, but real growth in productivity and output. America’s GDP growth over the past 50 years was fueled not only by debt accumulation, but also by the inordinate expansion of America’s financial sector, and by the artificial expansion of borrowing collateral due to foreign investment and overregulation which creates artificial scarcity. The housing market in California is a perfect example of this.
The best path forward is managed, moderate inflation, a stable currency, and a refocusing on genuine economic growth instead of growth in the financial sector. For this to happen, some if not most of these magically materializing trillions of dollars need to be directed into public and private investments in enabling physical infrastructure, research and development, aerospace and military technologies, pure and applied physics, and medical breakthroughs.
The worst thing that could possibly happen is to see all that money squandered on stock buy-backs, pension fund bailouts, much less “green” schemes and new bureaucracies to enforce “diversity.”
America is at a crossroads economically. The immediate challenges are daunting. But the good news is America remains well positioned to lead and inspire the world in the 21st century. How that happens is up to us.
* * *
Edward Ring is a co-founder of the California Policy Center and served as its first president. This article originally appeared on the website American Greatness.
