CPC Launches Local Fiscal Health Dashboard for California’s Cities, Counties and School Districts
Interactive Database Reveals which Local Governments are Fiscally Sound or at High-Risk of Fiscal Crisis
As of November 19, 2024, California Policy Center has updated its General Fund Reserves scoring to give maximum credit to entities whose unrestricted reserves equal 32% of general fund expenses. This replaces the previous scale, which ranged up to a 75% reserve ratio. As a result, a number of entities may see different scores than previously reported, and the rankings of top and bottom performers have shifted accordingly.
Sacramento — California Policy Center’s newly launched Local Fiscal Health Dashboard tracks the financial health of California cities, counties and school districts. The interactive database allows users to track how elected officials are managing local budgets, support ongoing budget decision making and identify financial red flags.
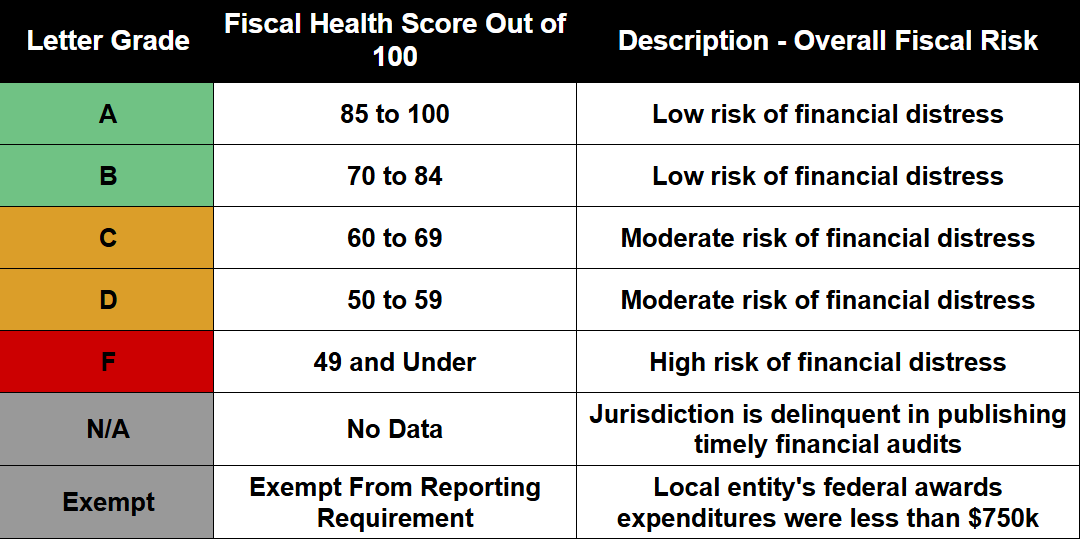
Each city, county and school district has been awarded a fiscal health score and letter grade from A to F, depending on how well they have managed their finances. Government entities are also identified and color-coded as low, moderate or high risk for fiscal distress.
“The public should have access to the tools necessary to ensure government budgets are transparent and government officials are held accountable,” said Lance Christensen, Vice President of Government Affairs at California Policy Center said. “Californians can’t allow government officials to sweep bad fiscal news under the rug.”
The Local Fiscal Health Dashboard fills a void in government transparency data left after the California State Auditor’s Office unexpectedly discontinued its popular Local Government High-Risk Dashboard last October. California Policy Center’s new dashboard was created to replace and expand on that data to ensure local governments maintain transparency and accountability when it comes to their budgets.
CPC’s dashboard uses public data from Annual Comprehensive Financial Reports (ACFR) that local governments are required to submit every year to get access to federal funds. The dashboard provides key financial metrics to allow local elected officials, analysts, reporters and citizens to understand how cities are performing overall and in comparison to other cities, and spotlight concerning financial trends.
Tracking local financial metrics, such as liabilities and revenue trends, is crucial. California has over $1.6 trillion in unfunded liabilities (debt) at both state and local levels. Many cities have potentially catastrophic unfunded pension liabilities. Other municipalities are making budget decisions based on incomplete, missing or delayed financial reports.
Cities are required to file their ACFRs — often referred to as annual audits — every year. Most municipalities submit their ACFRs within nine months of fiscal year end (as required by the federal and state governments), but many others are routinely — and egregiously — late in filing their required annual financial reports. That means local officials are left to make budgeting decisions without current fiscal information.
Out of 482 cities, 82 (or 17.01%) received an “A” grade; 7 (or 1.45%) received an “F” grade, indicating they are at high-risk of fiscal catastrophe; and 56 cities (or 11.62%) are delinquent in submitting their 2023 ACFR. (16 cities are exempt from reporting.)
A whopping 169 cities, counties and school districts have still not submitted ACFRs for 2023. Twenty-six of those cities, counties, and school districts that are missing their 2023 ACFR are nevertheless asking voters to okay a local tax increase on the November ballot and/or approve new bonds totaling $534.6 million in new borrowing.
“When cities don’t turn in their fiscal reports on time, city officials have to make important budget decisions without the data they need,” said Christensen. “Even worse, many of the cities who aren’t on top of their financial reports are proposing tax increases and putting local bond measures on the ballot ”
Best and Worst Performing Cities
To access an interactive infographic click here.
Based on the dashboard data, California Policy Center has identified 10 of the best and worst performing cities statewide when it comes to financial health. The dashboard designates the level of financial risk as low, moderate or high.
This financial risk determination is achieved by evaluating each entity on ten key fiscal metrics: General Fund Reserves, Debt Burden, Liquidity, Revenue Trends, Pension Costs, Pension Funding, Pension Obligations, Other Post Employment Benefit Obligations, Other Post Employment Benefit Funding, and Net Worth.
Best Performing Cities Statewide: The following 10 cities earned the highest fiscal health scores and an “A” grade:
- Danville – 98 (Contra Costa County)
- Eastvale – 98 (Riverside County)
- Laguna Woods – 96 (Orange County)
- Rancho Mirage – 96 (Riverside County)
- La Quinta – 96 (Riverside County)
- Indian Wells – 96 (Riverside County)
- Dublin – 96 (Alameda County)
- Lake Forest – 95 (Orange County)
- La Mirada – 94 (Los Angeles County)
- Jurupa Valley – 94 (Riverside County)
Worst Performing Cities Statewide: 10 of the worst performing cities are considered high-risk for fiscal stress, including the ability of the city to pay its bills in the short and long term.
The following cities earned the lowest fiscal health scores and an “F” grade:
- West Covina – 43 (Los Angeles County)
- Ukiah – 45 (Mendocino County)
- Atwater – 46 (Merced County)
- Orange – 46 (Orange County)
- Lindsay – 47 (Tulare County)
- Calexico – 48 (Imperial County)
- Pinole – 49 (Contra Costa County)
With many cities having yet to file ACFRs for FY 2023 — and, in some cases, FY 2022 — this list of worst cities is subject to change. Some cities with poor financial metrics are often late filers.)
How to use the Dashboard
Information about California cities, counties and school districts can be found via the dashboard here. To understand how to use the dashboard, an easy how-to guide can be found here.
What can local officials do to course-correct if their city is fiscally off track?
California Policy Center has also released a Municipal Finance Triage Guide to help local elected officials better evaluate what they can do to improve their budget forecasting, planning and management, and help at-risk cities proactively address foreseeable challenges.
Local Fiscal Health Dashboard Scoring Table
Methodology
CPC’s Local Fiscal Health Dashboard uses public data from Annual Comprehensive Financial Reports that local governments are required to complete and share with the public annually. Similar to the now defunct State Auditor’s High-Risk Dashboard, the new Local Fiscal Health Dashboard provides a metric for evaluating the financial health of government entities and designates their level of financial risk as low, moderate or high.
The methodology used in creating CPC’s Local Fiscal Health Dashboard was developed by the Hoover Institution’s State and Local Governance Initiative, which examines state and local municipal data nationwide. The Hoover Institution’s methodology is based on the one used by the State Auditor with some changes made to address data availability. CPC’s dashboard takes a comprehensive look at not just California’s cities but also counties and school districts. CPC’s Local Fiscal Health Dashboard was developed in partnership with California Policy Center senior fellow Marc Joffe, who also contributed to the previous State Auditor’s High Risk Dashboard.