
Discrimination to Ensure Diversity – A Goldmine for Government Unions
It is impossible to achieve diversity without discriminating. The only way that would be possible would be if every imaginable human subgroup were equally qualified to perform every imaginable task. In reality, while individual talents vary dramatically in a manner completely irrespective of group identity, on average, groups exhibit huge and verifiable differences in aptitude.
The objective of diversity, however, is indifferent to this fact. To achieve their objective, discrimination against the more qualified is inevitable. To enforce this across all walks of life, a growing army of unionized government bureaucrats have been hired.
When it comes to discrimination in the name of diversity, California is the trendsetter. It is the most diverse state in America, it has the worst performing K-12 system of public education of any large state, and it has the most left-leaning electorate in America. And to enforce discrimination to ensure diversity, California has its all-powerful public sector unions, that will support any new bureaucracy that increases its numbers.
The University of California provides a perfect example of how discrimination to ensure diversity is working. Starting at the top, each campus has a “Chief Diversity Officer.” Take a look at the pay and benefits packages for these individuals, bearing in mind how many high-paid administrators must work for each of them:
(1) Berkeley, Oscar Dubón, Jr., Vice Chancellor for Equity and Inclusion, (2) Davis, Adela de la Torre, Vice Chancellor for Student Affairs and Campus Diversity, (3) Irvine, Doug Haynes, Vice Provost for Academic Equity, Diversity and Inclusion, (4) Los Angeles, Jerry Kang, Vice Chancellor for Equity, Diversity and Inclusion, (5) Merced, Luanna Putney, Associate Chancellor & Senior Advisor to the Chancellor, Ethics and Compliance, (6) Riverside, Mariam Lam, Associate Vice Chancellor for Diversity, Excellence and Equity, (7) San Diego, Becky Petitt, Vice Chancellor for Equity, Diversity and Inclusion, (8) San Francisco, Renee Navarro, Vice Chancellor for Diversity and Outreach, (9) Santa Barbara, Maria Herrera-Sobek, Associate Vice Chancellor for Diversity, Equity and Academic Policy, (10) Santa Cruz, Ashish Sahni, Associate Chancellor, Office of Diversity, Equity and Inclusion.
The average pay and benefits for each of these ten University of California Chief Diversity Officers was $311,474 in 2016. To get just a partial idea of what members of their staff, or members of the California’s overall diversity bureaucracy make, go to Transparent California and search job titles under the key words “diversity” or “inclusion.”
The toxic impact of California’s unionized diversity bureaucracy is hard to overstate. California’s K-12 public schools have been destroyed by unionization, which, among other bad things, caused the worst teachers to end up in the poorest, most disadvantaged neighborhoods because they could not be fired. But why fix the K-12 public schools, when you have a diversity army that forces college admissions to reflect proportional representation regardless of academic performance?
The University of California’s “Freshman Admissions Count” for 2017 showed the following results by ethnicity: 34.2% Asian, 33.2% Latino, 23.8% White, 5.0% Black, and 3.9% “Other.”
Here’s where the tactics of the diversity army become truly suspect, because they aren’t just discriminating in order to achieve proportional representation. If they were, based on the numbers of college-aged Californians by ethnicity, 2017 admissions would have been 13% Asian, 50% Latino, 31% White, and 6% Black.
To put this in perspective, a recent California Policy Center analysis that took into account the number of college age students along with SAT performance, came up with what should have been UC’s 2017 freshmen class if admissions were based on merit: 21% Asian, 35% Latino, 41% White, and 3% Black. The CPC analysis, moreover, yielded understated results because the SAT criteria used was “met college ready benchmark,” whereas in reality the UC system purports to admit students who greatly outperform the “college ready” SAT benchmark. This is an important distinction – it means that in reality, a far greater percentage of Asians and significantly greater percentage of Whites would be admitted in a hypothetical merit based analysis, if more complete SAT data were accessible.
One can only assume the UC diversity bureaucracy, controlled by the UC Regents, who are themselves controlled by the State Legislature, did not reduce Asian admissions to their proportional representation because Asians still vote – by a margin of two-to-one, in favor of Democrats. So Asians were admitted to the UC system more-or-less based on their merit. Blacks were admitted based on proportional representation. Latinos, comprising 50% of college age students, but at most 35% of merit-based successful applicants, broke nearly even on that basis with 33% of the admissions. But where did that leave the Whites? Instead of being at least 41% of the successful applicants based on merit, only 24% of the UC system’s 2017 freshman class are White. Apart from keeping Asians firmly in the Democratic voting bloc, does any of the University of California’s systemic racial discrimination to enforce “diversity” actually help anyone?
It certainly doesn’t help White and Asian students who are left behind. It also doesn’t help Latino or Black students who are admitted to an elite university without having the academic skills to succeed. Rather than fix the ruined K-12 system that, thanks to union work rules, demonstrably provides inferior public education to the Black and Latino communities, the rules are changed and manipulated to get them into a UC program anyway. And then in an attempt to accommodate them, the campus syllabus becomes rife with academically weak majors in various types of ethnic studies.
Could it be that much of the campus polarization we are witnessing is because unqualified, struggling students are being indoctrinated to believe their academic failures are caused by racism instead of taking personal responsibility?
Discrimination to enforce diversity is not confined to academia. It is institutionalized across most of corporate America. It is enshrined in countless laws and incentives which are designed to “level the playing field,” but in reality discriminate against more qualified actors. It breeds bitterness and corruption. It creates tribalism where none had previously existed.
Ultimately, as America becomes more “diverse” at the same time as huge gaps in aptitude and achievement remain between groups, discrimination to enforce diversity in all areas of life will become increasingly tyrannical. And as it occurs, the role of government unions will remain pervasive and negative. They will continue to ruin inner city schools, then hire lavishly compensated bureaucrats to enforce equal outcomes.
* * *
Edward Ring co-founded the California Policy Center in 2010 and served as its president through 2016. He is a prolific writer on the topics of political reform and sustainable economic development.
FOOTNOTES
(1) The University of California’s “InfoCenter” has interesting data on graduation rates by ethnicity. The data is through 2016, meaning that graduation rates within six years of entry are available for freshmen entering the UC system in 2010. Here is a summary of results by ethnicity:
White – 64.5% graduated within four years, 86.1% graduated within six years.
Asian – 63.9% graduated within four years, 88.1% graduated within six years.
Latino – 47.1% graduated within four years, 77.6% graduated within six years.
Black – 46.8% graduated within four years, 75.4% graduated within six years.
(2) The University of California’s “Diversity Accountability Report 2017” collects an amazing amount of data on how students and faculty “feel” about their group identity, but not much in terms of useful data on academic performance by ethnicity. For example, no data is provided, by ethnicity, on how many non-international undergraduates chose STEM majors. Some information in this regard can be gathered for UC graduate students – ref. table 7.2.1. The percentage of non-foreign graduate students who pursue post-graduate degrees in either the physical sciences, engineering, or computer science, by ethnicity, are: 67% White, 26% Asian, 6% Latino, and 1% Black.
(3) Some examples of pertinent information – at least to any diversity advocate (or critic) – that do not appear to be available on the UC “diversity” website pages are the following: What number and percentage of non-foreign undergraduates pursue STEM majors, by ethnicity, and what are their graduation rates? And, what number and percentage of non-foreign undergraduates pursue non-STEM majors, by ethnicity, and what are their graduation rates? What were the SAT scores – numbers and percentages by ethnicity – of applicants who were accepted to the 2017 freshman class in the UC system? What were the SAT scores – numbers and percentages by ethnicity – of applicants who did not gain acceptance to the 2017 freshman class in the UC system? With respect to SAT scores – is there any report that has compiled a bell-curve distribution showing the range of SAT scores from highest to lowest, proportioned by quantity of test takers, per ethnic group, on one overlay?
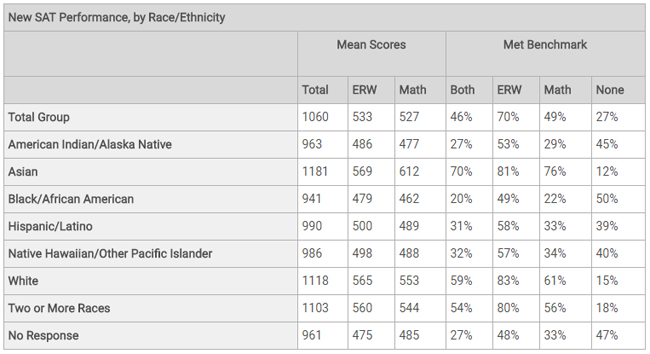
(4) The high school class of 2017 – admitted to the UC system as incoming freshmen in the Fall of 2017 – earned SAT scores by ethnicity as shown on the following chart (below) from the SAT College Board. As can be seen, across the U.S., the percentage of test takers who met the college-ready benchmark varied significantly by ethnicity – 70% of Asians met the benchmark, 59% of Whites, 31% of Latinos, and 20% of Blacks. Moreover, as documented by Ed Source, the disparity between the SAT performance of California’s students and all U.S. students is not significant. In fact, the average Math/Reading combined score for California’s White students was 1,153 vs. 1,118 nationally; for Latinos, 992 CA vs. 990 US; Asians 1,145 vs 1,181 US; Blacks 961 vs 941 US.
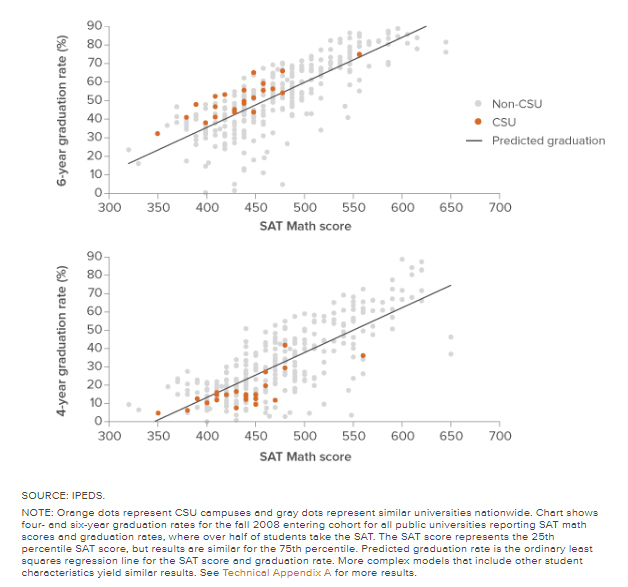
(5) In May 2016 the Public Policy Institute of California produced a study that includes data that tracks the correlation between SAT scores and graduation rates. As can be seen on Figure 4 in the study (shown below), the correlation is quite high. The upper chart depicts six year graduation rates, the lower chart depicts four year graduation rates. The orange dots represent results for Cal State campuses, which were the focus of the study. The more numerous grey dots represent similar universities nationwide. As can be seen, it is roughly accurate to state that for every 50 point improvement in a student’s Math SAT score, there is a 10% greater probability that they will graduate from college.
Correlation between SAT Math score and graduation
(6) As California’s population becomes more “diverse,” the proportion of “mixed race” individuals will proliferate. This is a welcome development to anyone who believes in assimilation, but may be of great concern to the diversity bureaucrats. For the UC System, for example, to handle this complexity, one recommendation is they require all applicants to submit to blood tests to determine their ancestry. Some of the new services, such as “Advanced Ancestry” can offer tremendous detail, showing the DNA based areas of origin for any human. The bureaucrats only need overlay that data with the geographic areas around the world that are known to be the places of origin for “marginalized peoples,” and they will have exactly what they need to continue to discriminate against individuals in order to enforce equality of group outcomes.
(7) Then again, since DNA affects individuals differently, it may not be possible to properly identify “people of color” for discriminatory favoritism based solely on geographically based DNA analysis. To compensate for this, the UC diversity bureaucrats can learn a great deal from the American Progressives of the early 20th century, and, for that matter, the German Nazis of the WWII era. Both of these groups created a robust set of best practices aimed at classifying humans based on their racial appearance. Going into the details of these best practices would go beyond the scope of this report, but clearly the UC diversity bureaucrats, and all diversity bureaucrats, can learn a lot of useful skills from their racist predecessors of the previous century.
* * *