Local Fiscal Health Dashboard – Methodology & Glossary
CPC’s Local Fiscal Health Dashboard was designed to fill a void in government transparency data left after the California State Auditor’s Office unexpectedly discontinued its popular Local Government High-Risk Dashboard in 2023. CPC’s dashboard uses public data from Annual Comprehensive Financial Reports (ACFRs) that local governments are required to share with the public annually.
The methodology used in creating CPC’s dashboard was developed by the Hoover Institution’s State and Local Governance Initiative for its Stanford Municipal Finance Dashboard, which examines state and local municipal data nationwide. The Hoover Institution’s methodology is based on the State Auditor’s methodology, with some changes made to address data availability.
This dashboard provides a financial snapshot in time for cities, counties, and school districts across California. There are still many jurisdictions that have not completed their ACFRs for 2024 and prior years. Some entities are considered “exempt” from the reporting requirement by the California State Controller’s Office
Find a full tutorial on using the Local Fiscal Health Dashboard here. Original press release here.
For more details about the weighting of the ten individual dimensions, along with how the key financial ratios are translated into a score, please see the working paper: here
Single audit reporting packages are due nine months after the entity’s fiscal year end under 2 CFR 200.512. For most California entities, the reporting package is due March 31st of each fiscal year. In some circumstances cities are exempt from the ACFR reporting requirement. If the local government entity’s federal awards expenditures were less than $750,000, it must provide the SCO with written notification of their exempt status. Exempt status notifications are due nine months after the entity’s fiscal year end.
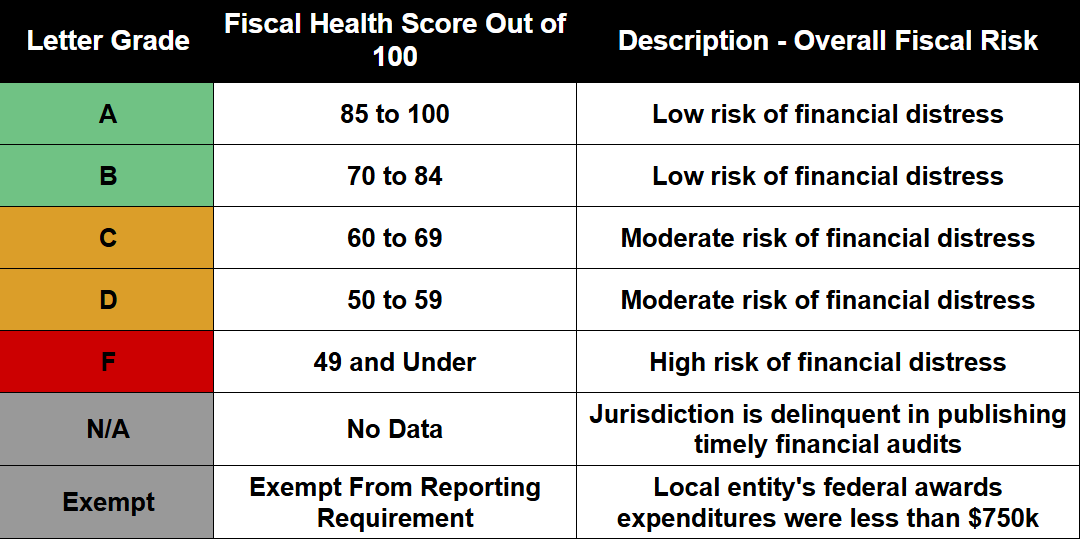
Scoring
What are the ten performance metrics that determine a jurisdiction’s financial score?
General Fund Reserve Score – Rates the extent to which a jurisdiction’s general fund reserves are sufficient to cover general fund expenditures. The metric is calculated by dividing general fund unrestricted fund balance by total general fund expenditures less transfers to other funds. The larger the general fund reserve ratio (ex. a ratio of 2.5), the better, because this indicates sufficient reserves. Low reserve ratios, such as 0 or 0.2, receive low scores.
As of November 19, 2024, California Policy Center has updated its General Fund Reserves scoring to give maximum credit to entities whose unrestricted reserves equal 32% of general fund expenses. This replaces the previous scale, which ranged up to a 75% reserve ratio. As a result, a number of entities may see different scores than previously reported, and the rankings of top and bottom performers have shifted accordingly.
Debt Burden Score – Rates the size of the government’s long-term obligations (excluding pension, OPEB) relative to its revenues. The metric is calculated by dividing non-retirement long-term obligations by revenues. The smaller the debt burden ratio (ex. a ratio of 0.1 or 0.2) the better, since this indicates relatively little long-term debt compared to revenue.
Liquidity Position Score – Rates the extent to which general fund cash, cash equivalents, and investments will cover the general fund’s liabilities. The metric is calculated by dividing general fund cash and equivalents plus general fund investments divided by general fund liabilities. A high liquidity ratio (ex. a ratio of 16) indicates the government has access to plenty of liquid assets to cover immediate cash outflow and will therefore be assigned a high score for this metric. On the other hand, low ratios (ex. 0.5) will earn poor scores. As the State and Local Government Financial Fundamentals paper by Duffy and Giesecke notes, “a government with absolutely no liquidity is likely to file for Chapter 9 [bankruptcy] proceedings.”
Revenue Trend Score – Rates the growth of general fund revenue over the last 3 years. The metric is calculated by finding the geometric annual growth rate of general fund revenues for the relevant time period. A positive revenue growth ratio indicates growth (ex. A revenue growth ratio of 0.2 is a positive trend and therefore will earn a good score for this metric, whereas a revenue growth ratio of 0 or -0.1 will earn a low score).
Pension Costs Score – Rates the portion of revenues that is consumed to fund pension obligations, and thus the fiscal burden that pension costs exert. The metric is calculated by dividing the actuarially required pension contribution by the revenues for that year. A lower ratio (ex. 0.01) indicates a lower proportion of revenues required to fulfill the required contribution and therefore a higher score for the metric, whereas a higher ratio (ex. 0.15 or 0.17) indicates a higher pension burden.
Pension Funding Score – Rates the proportion of a government’s pension liability that is covered by pension assets and investments. The metric is calculated by dividing fiduciary net position by total pension liability. A higher ratio (ex. 0.95) indicates a higher proportion of the pension liability that is covered, and therefore will earn a higher score than a low ratio (ex. 0.65). Pensions should be funded at or above 100 percent rather than the commonly suggested 80 percent.
Pension Obligations Score – Rates the size of a government’s net pension liabilities relative to the government-wide revenue. The metric is calculated by dividing net pension liability by revenues. A lower ratio (ex. 0 or 0.02) indicates lower obligations relative to government-wide revenues and therefore will earn a better score than a higher ratio (0.8 or 1).
OPEB Obligation Score – Rates the size of a government’s net OPEB liabilities relative to the government-wide revenue. The metric is calculated by dividing the net OPEB liability (the difference between OPEB fiduciary net position and total liabilities) by the revenues. A lower ratio (ex. 0 or 0.01) indicates lower unfunded OPEB obligations as a share of government-wide revenues and therefore will earn a better score than a higher ratio ( ex. 0.8).
OPEB Funding Score – The OPEB funding score rates the degree to which a government fully funds its OPEB liabilities. A higher ratio (ex. 0.9) indicates a high proportion of funding and will therefore earn a better score than a low ratio (ex. 0.08). Jurisdictions that have a lower funding funding score may likely be using a pay-as-you-go process for funding retiree healthcare costs which could cause greater pressure on general fund spending and medical increase or continue to inflate.
Net Worth Score – The net worth score rates the size of a government’s unrestricted net position relative to government-wide revenues. The metric is calculated by dividing unrestricted net position by government-wide revenues. A higher share of unrestricted net assets relative to revenue will earn a higher score than negative assets or a small share of assets. This yields an approximate measure of the net worth, making it a good proxy for balance sheet health and can be used as a good apples-to-apples comparison with any comparable jurisdiction.
Glossary
ACFR (Annual Comprehensive Financial Report): A standardized financial report produced by state and local governments that includes detailed information on financial position, performance. The government entities hire professional auditors to prepare the reports in adherence to accounting requirements set by the Governmental Accounting Standards Board. It provides insights into governmental assets, liabilities, revenues, and expenditures.
Actuarially Required Contribution: The amount of money a government must contribute annually to a pension fund, determined by an actuary, to keep it adequately funded and meet future obligations. Government entities who participate in CalPERS (California Public Employees’ Retirement System) are required under state law to contribute to the system, and the valuations are determined by benefits the entity provides, how many employees are covered, etc.
Fiduciary Net Position: This refers to the value of assets held in a pension or other trust fund after subtracting any liabilities associated with the fund. It provides a snapshot of the fund’s financial health, representing the available resources that can be used to meet future benefit payments.
Geometric Annual Growth Rate: This rate shows the average rate of growth per year over a period, accounting for compounding. GAGR is often used in revenue growth projections for more accurate financial trend analysis.
Liquidity: Liquidity assesses a government’s capacity to cover short-term liabilities using cash, investments, or other liquid assets. The Government Finance Officers Association recommends that governmental entities regularly perform forecasting to ensure they have sufficient liquidity.
Normal Cost: In the context of public pensions, the normal cost is the portion of the total cost of pension benefits that is allocated to a specific year of service for current employees. It reflects the present value of future benefits earned by employees for their service in a given year, not accounting for any past underfunding or overfunding of the pension plan.
OPEB (Other Post-Employment Benefits): These are benefits, primarily healthcare-related, provided to retired government employees besides pensions. OPEB obligations represent the government’s liability to fund these benefits, similar to pension liabilities.
Reserves: Funds set aside by the government in its general fund to cover unexpected expenses or revenue shortfalls. These reserves are not meant to be spent on regular expenditures, but should rather be set aside as a rainy day fund for emergencies. Reserves indicate fiscal stability and are generally expressed as a percentage of annual expenditures.
Special Fund: These are government funds designated for specific purposes, typically funded by particular revenue sources like taxes, grants, or fees. Special funds ensure that revenues are used only for intended, legally-defined purposes.
Unrestricted Net Position: This is the residual amount of a government’s assets minus liabilities that are not restricted for specific uses, providing a measure of the government’s net worth and overall financial health.
Definitions Derived from the Hoover Instition’s Municipal Finance Issuer Fundamentals.
Methodology Source – Giesecke, Oliver and Duffy, Seamus, State and Local Government Financial Fundamentals (September 7, 2023). Available at SSRN: https://ssrn.com/abstract=4565350 or https://dx.doi.org/10.2139/ssrn.4565350