In Search of Government Union Transparency
Anyone who thinks it’s easy to calculate the total annual revenue of California’s government unions hasn’t tried to do it. And this statistic is vital to understanding one of the most powerful forces – if not the most powerful force – in California’s state and local politics.
The problem with getting accurate ground-up revenue numbers is that California is home to many hundreds, if not thousands, of local public-sector union affiliates all filing separate 990 forms. Those forms often include financial transfers between entities that have to be offset in any thorough analysis. The organization of the information on these 990 forms is missing useful variables, and the data-entry varies from filer to filer. Complicating matters, the 990 data is on PDF files that cannot be parsed, and even if you were to transcribe hundreds of them onto a spreadsheet, there would be no way to know if you’d found them all.
For these reasons, a top-down estimate relying on informed assumptions is the only practical way to proceed with limited time and resources.
Back in 2010, after finding nothing online, the California Policy Center published “Public Sector Unions & Political Spending.” In that study, we based our estimate of total political spending on three variables: (1) the number of public sector workers are members of unions, (2) the average annual union dues payment per worker, and (3) the percentage of union dues used by the unions for political activity. A subsequent analysis, “California’s Government Unions Collect $1.0 Billion Per Year,” published in 2015, arrived at that estimate by multiplying updated estimates of the first two variables – the number of unionized workers times the average dues per unionized worker. More on this later. First, here is information on some of the key variables necessary to perform a top-down analysis.
WHAT PERCENT OF CALIFORNIA’S STATE AND LOCAL GOVERNMENT EMPLOYEES ARE UNIONIZED?
Getting this data depends on limited sources that provide only estimates. For example, the 2003 UC Berkeley study “California Union Membership: A Turn-of-the-Century Portrait,” which estimated total government union membership at 53.8 percent of all public employees, even today remains the only in-depth analysis we can find of California’s union membership.
That study relied on two datasets. One came from the annual U.S. Census; an excellent and ongoing distillation of that data is provided by UnionStats.com. The other dataset was the California Union Census, conducted in 2002 by UC Berkeley’s Institute for Research on Labor and Employment. That report has not been updated.
In any case, the updated U.S. Census survey for 2017, as compiled on the website UnionStats.com, estimates that 55 percent of California’s public employee unions are members of unions, up slightly from 2003.
HOW MANY STATE AND LOCAL GOVERNMENT EMPLOYEES ARE THERE?
Acquiring this data reveals another pitfall in attempting to perform a top-down estimate of government union revenue, because there are full-time and part-time employees, with reported totals varying. For example, the UnionStats.com reports 2,489,477 state and local government employees in California in 2017. Transparent California reports 2,529,468 state and local government employees in California in 2016. And the U.S. Census reports 1,523,255 full-time, 686,750 part-time, and 1,814,756 “full-time equivalent” state and local government employees in 2016.
Turning to the state controller’s “Government Compensation in California” website to resolve these differing totals yields a reported 326,413 city employees in 2017, 354,968 county employees, 162,764 special district employees, 247,177 state employees, 19,125 superior court employees, 291,141 University of California employees, 119,475 California State University employees, 161,863 Community College District employees, and 658,135 K-12 education employees. That totals to 2,341,061 employees in 4,376 agencies, and does not include 1,456 agencies that did not respond to the State Controller’s request for this information.
WAYS TO ESTIMATE TOTAL DUES COLLECTIONS
The top-down method to do this requires estimating the total number of unionized employees in the state and local workforce, and multiplying that number by the average annual union dues. Getting a good value for both of these variables is problematic. Even assuming the 55 percent unionization percentage is accurate, despite having this number only via sampling surveys, there is still the need to estimate the total number of state/local employees. Four sources offer a total: 2.49 million from UnionStats.com, 2.52 from Transparent California, 2.21 from the U.S. Census, and 2.34 from the State Controller. Because Transparent California’s data comes directly from payroll departments of local agencies, that number is likely accurate despite being higher than the others. Applying 55 percent to 2.5 million workers yields a union membership estimate of 1,375,000.
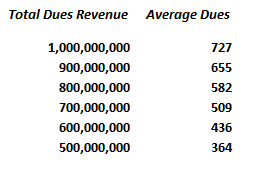
Average union dues are very hard to pin down – and not only because many of their members are part-time workers who will not pay the full dues. Union dues vary because they’re based on the various rates of union dues and on the pay scale of each individual employee. Before discussing how much these amounts vary, here are the average dues per member based on various assumed total statewide union revenue:
Average Annual Union Dues Based on Various Total Union Dues Revenue
(assume total California state/local agencies have 1.375 million union members)

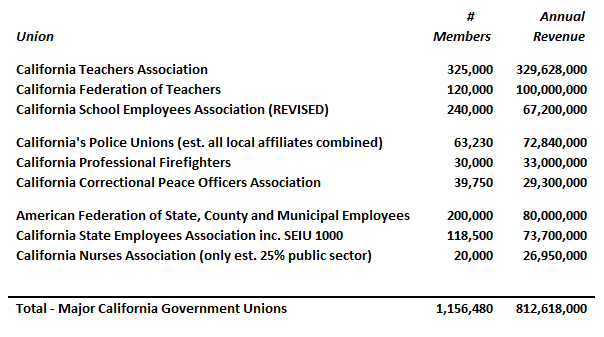
This chart (above) is only a first step, but it provides a good way to get an idea of what estimate may be reasonable. But how many of these union members are full-time? And how much do members of various unions pay? In a previous analysis, published last week and edited later that week after receiving feedback from some of the unions being analyzed, we made assumptions based on available information about the major government unions active in California. We learned, for example, that the dues for California School Employees Association (CSEA) members are capped at $472.50 per year, and that the total dues for their 240,000 members are roughly $70 million per year including dues retained by their local affiliates. We also assumed that on average California’s full-time teachers and public safety employees pay around $1,000 per year in dues, possibly more. Overall, the analysis came up with a total dues estimate for all of California’s government unions of around $800 million per year.
California’s Public Sector Unions (including local affiliates)
Estimated Total Membership and Revenues

A WAY TO IMPROVE UNION TRANSPARENCY
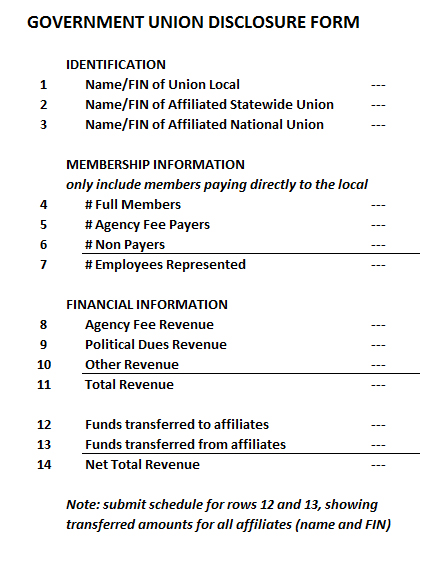
When considering the tremendous influence government unions have in California – the public safety unions, for example, exercise immense power in California’s cities, and the teachers union wields equal power in Sacramento – it would be proper to have more complete information on their operations. To this end, it would be helpful and in the public interest if every government employee union that files a 990 form with the IRS each year would also be required to file with the State of California – and post online – the following completed form:

Having these documents would still not be enough, however. The forms could not be accepted in PDF format, but instead provided in a standardized, downloadable and parsable format, so consolidations could be easily performed by online viewers. Moreover, it would be necessary to require a Federal Identification Number (FIN), in a separate field, for each filer, as well as the FIN of any affiliate to which they either send or receive funds. This will make it possible for an analyst to easily develop consolidated total revenue figures for each of the major unions and their affiliates.
If and when this happens, we will finally know how much money California’s public sector unions are collecting and spending each year. But don’t count on the state legislature to do this. Perhaps it can be accomplished with Freedom of Information Act Requests, or California Public Record Act Requests, but these unions – despite the fact they organize public workers – may successfully argue they are not public entities and are therefore exempt from such requests. That leaves reform to either court challenges or a citizens initiative.
Not knowing how much public sector unions are spending each year, or what they’re spending it on, is unhealthy for our democracy.
* * *
RELATED POSTS AND REFERENCE LINKS
California’s Government Unions Collect An Estimated $800 Million Per Year, CPC Analysis, July 2018
California’s Government Unions Collect $1.0 Billion Per Year, CPC Analysis, May 2015
Understanding the Financial Disclosure Requirements of Public Sector Unions, CPC Study, June 2012
Public Sector Unions & Political Spending, CPC Analysis, Sept. 2010
Government Compensation in California, State Controllers Office
2016 Government Employment and Payroll Tables, U.S. Census Bureau
California Union Membership: A Turn-of-the-Century Portrait, Milkman & Rooks, 2003, UC Berkeley
* * *

