Inflation-Adjusted San Francisco Home Prices Higher Than During 2007 Housing Bubble
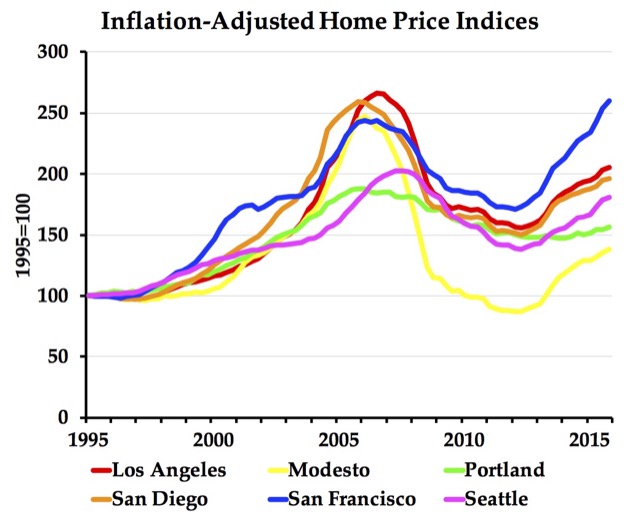
Last week, the Federal Housing Finance Agency released its quarterly home price indices for the fourth quarter of 2015, so we now have a 41-year time series for every state and many metropolitan areas. The numbers show that, even after adjusting for inflation, housing prices in the San Francisco Bay Area have exceeded prices during the peak of the housing bubble.

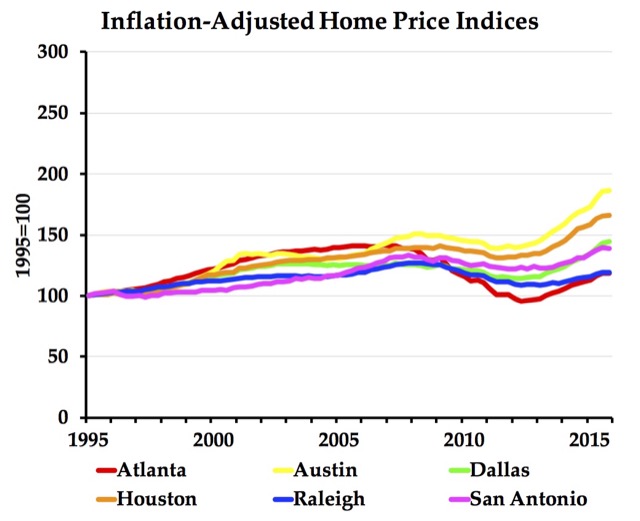
The data show that prices are also rising for some metro areas, such as Houston and Dallas, that didn’t bubble in the 2000s (see chart below). However, this increase is due to higher incomes in those areas; the home value-to-income ratios have remained about the same, while those for the metro areas in the above chart have increased from the post-bubble crash. Austin’s increase is partly caused by strict regulation in the city, though many of its suburbs remain affordable.

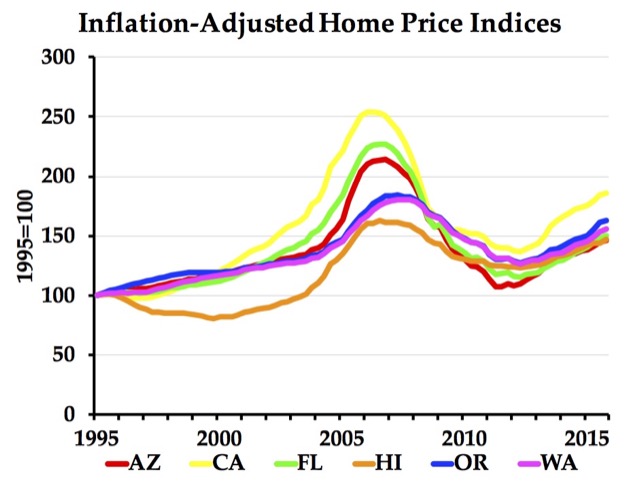
While you can download the data from the above link, the Antiplanner has enhanced the files to make it easy to make charts such as the ones above. One file is for metropolitan areas and the other is for states. To use the metropolitan areas spreadsheet, look up the number of up to six metro areas that you want to display in columns I and J. Then enter those numbers in cells AA1 through AF1 (not cells S1 through X1). The spreadsheet will display a chart in nominal dollars in roughly cell AQ5 and in inflation-adjusted dollars in roughly cell AQ44.

In the states spreadsheet, simply enter the two-digit abbreviations for the states you want in cells BH169 through BM169. The inflation-adjusted chart will display in roughly BO169. I didn’t make a nominal-dollar chart, but if anyone really needs one, I could do so.
By default, the charts display 1995 through 2015 even though the spreadsheets have data going back to 1975 for all states and the larger metro areas. You can change the years displayed in the chart by selecting a chart, scrolling to the left to find the highlighted cells used in the chart, then grabbing a right-hand corner of those highlighted cells and dragging up or down.
About the Author: Randal O’Toole is a Cato Institute Senior Fellow working on urban growth, public land, and transportation issues. In his book The Best-Laid Plans, O’Toole calls for repealing federal, state, and local planning laws and proposes reforms that can help solve social and environmental problems without heavy-handed government regulation. O’Toole’s latest book is American Nightmare: How Government Undermines The Dream of Homeownership. This post originally appeared on his blog “The Antiplanner” and appears here with permission.
