Local Fiscal Health Dashboard Tutorial
Welcome to California Policy Center’s Local Fiscal Health Dashboard.
Check out a quick 5 minute video tutorial here or a written tutorial below.
California Policy Center (CPC) has launched a new Local Fiscal Health Dashboard, an interactive database that evaluates the financial health of over 470 cities, 58 counties, and 940 school districts in California. Each entity is assigned a letter grade from A to F based on ten financial metrics and is given a designation as low, moderate, or high risk for fiscal distress.
This tool is designed to enhance local government transparency and accountability. It was designed to replace the public data previously made available by the discontinued State Auditor’s Local Government High-Risk Dashboard. The new Local Fiscal Health Dashboard provides a comprehensive resource to assess financial risks and budgeting practices. The dashboard draws on Annual Comprehensive Financial Report (ACFR) data submitted by municipalities, counties and school districts.
The following is a step-by-step guide to using the dashboard.
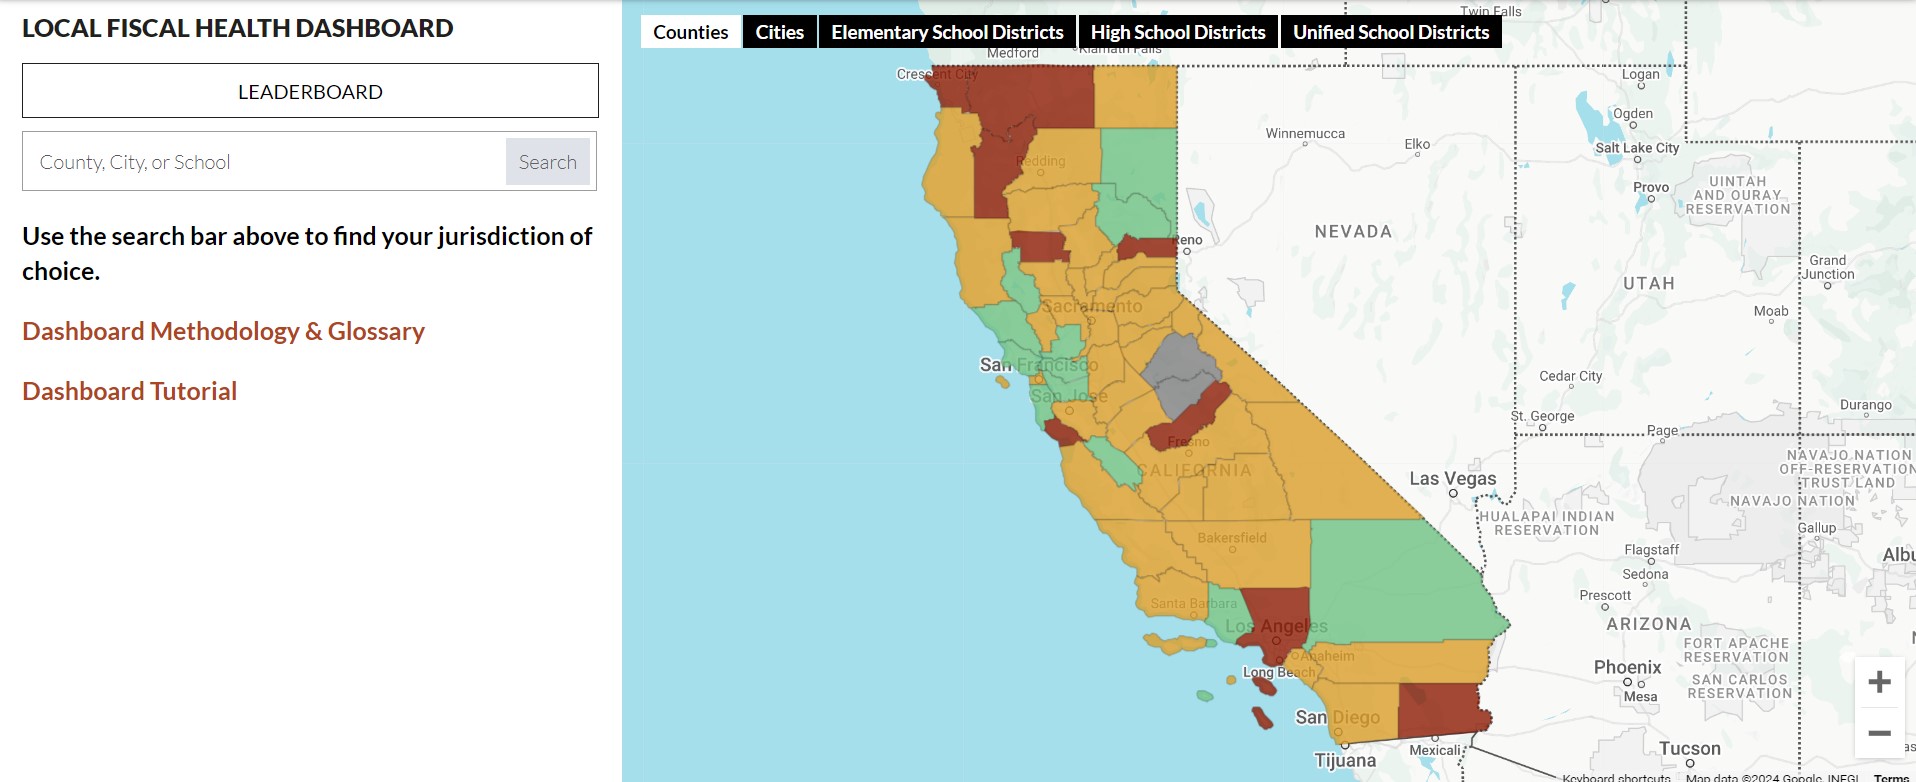
There are two key ways to navigate the dashboard. First, select the relevant button along the menu at the top to select a category for your search: Counties, Cities, Elementary School Districts, High School Districts, Unified School District.
Next, drag and zoom in on the jurisdiction of your choice and click on the location on the map.
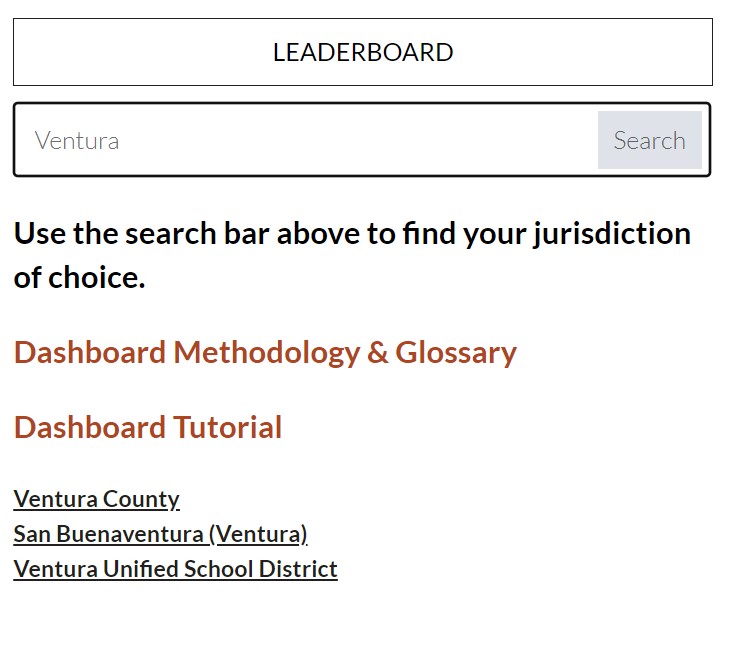
The second way to utilize the dashboard is to use the search bar in the upper left-hand corner of the home screen to search by name for the jurisdiction of your choice. Then click on the desired district’s name (see below using the example entity: Ventura County).
When you search by name using the search bar or select your desired jurisdiction from the map, the dashboard will then populate the most recent financial data report and rankings for that district on the left-hand sidebar.
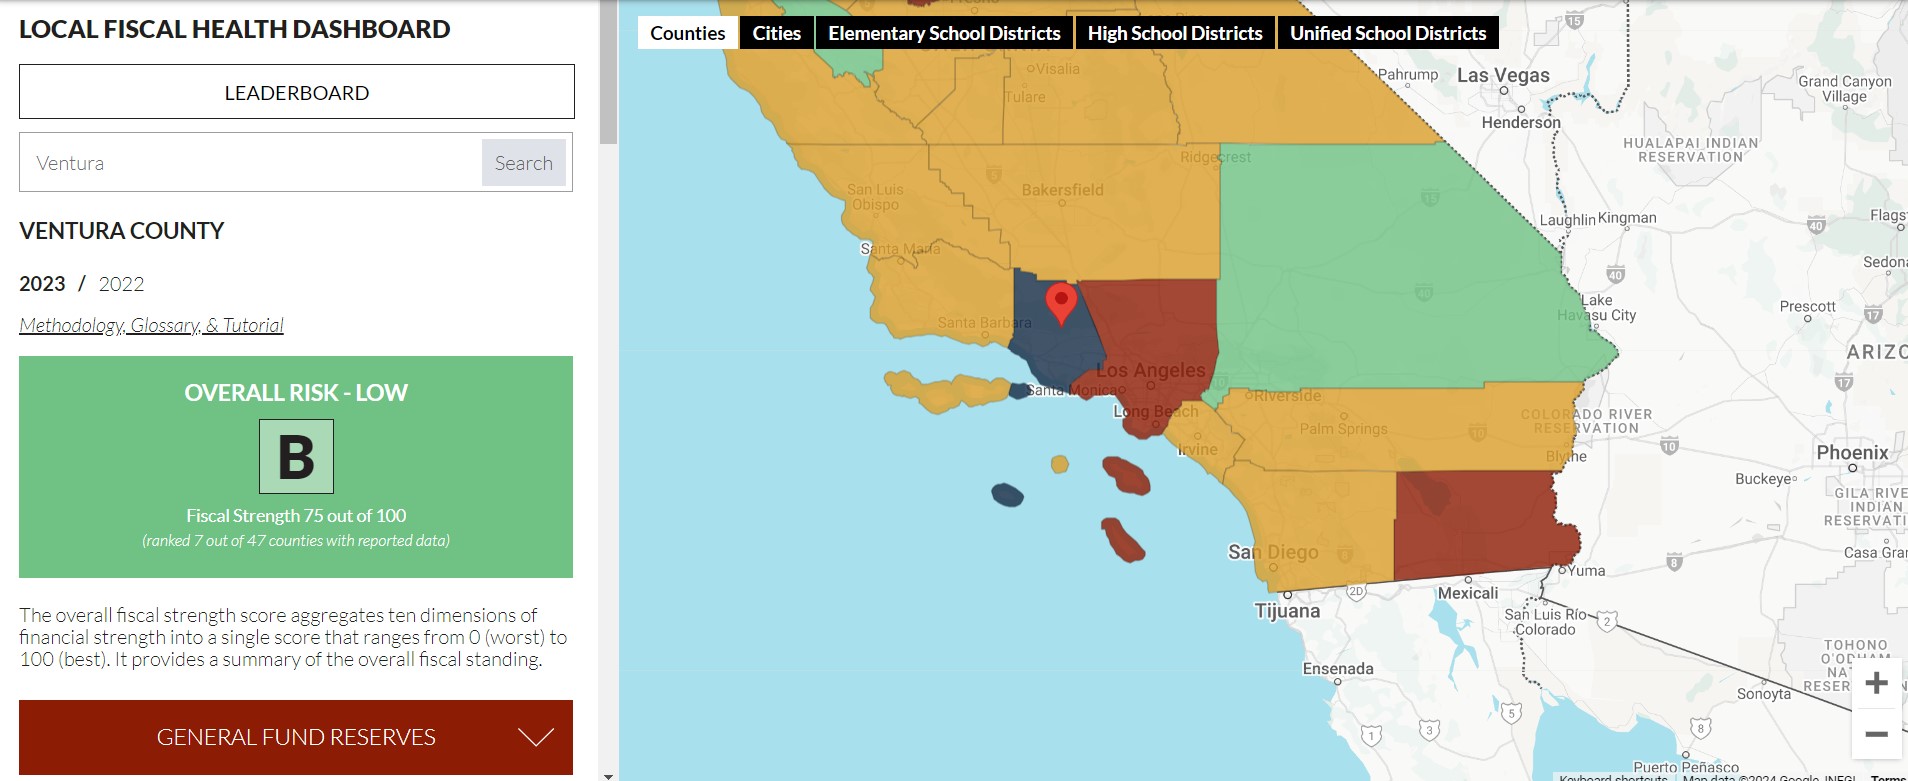
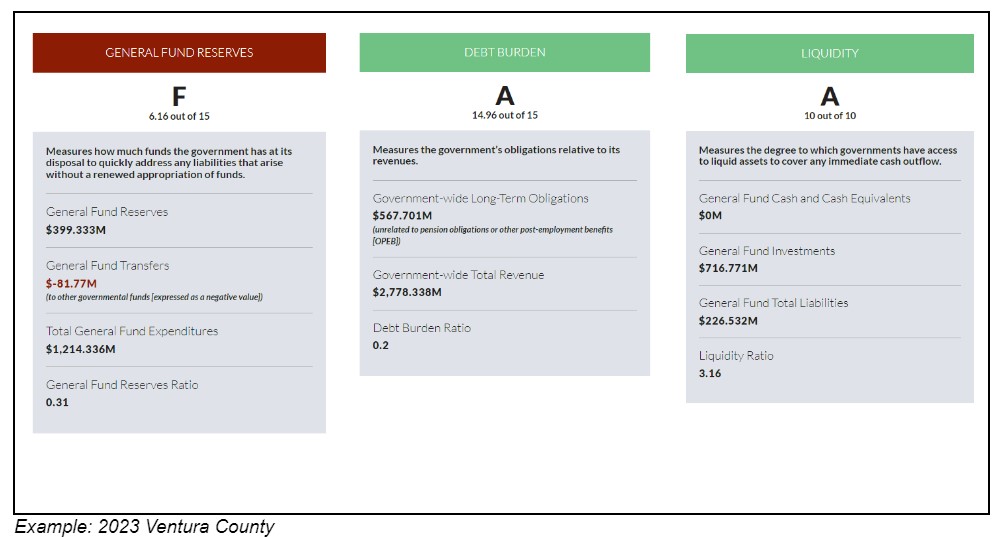
You can then see the overall fiscal position of your chosen jurisdiction. Scroll down to see more details on the 10 key performance metrics for the jurisdiction. Each jurisdiction’s 10 performance metrics provide dropdowns with the full data from the jurisdiction’s annual audit which has been evaluated to produce a letter grade for each metric.
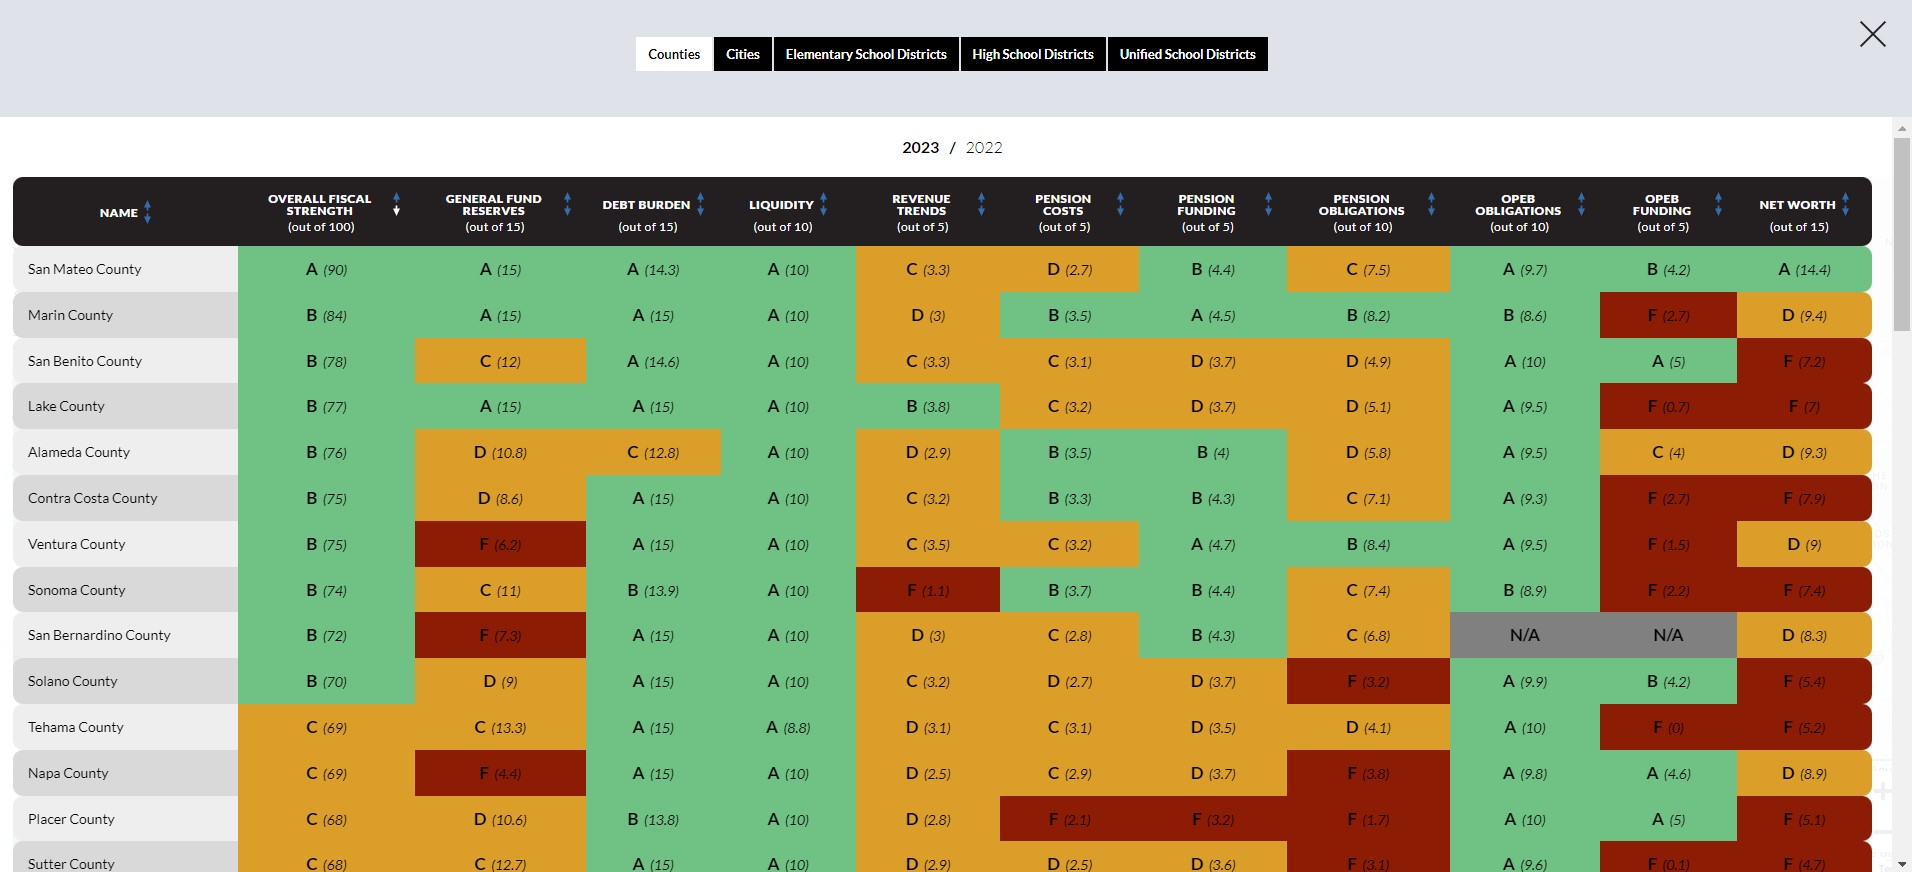
To see a full scoring data set you can click the leaderboard button at the top of the dashboard sidebar which will take you to the full dataset with filter options for each fiscal health ranking.