California Government Revenue and Debt Study
How Much State and Local Governments Collect and What They Owe
By Marc Joffe
Visiting Fellow, California Policy Center
December 10, 2025
California Government Revenue and Debt Study
How Much State and Local Governments Collect and What They Owe
By Marc Joffe
Visiting Fellow, California Policy Center
December 10, 2025
Is California’s public sector collecting too much and owing even more? Are government union demands for generous retiree benefits driving local budgets to the breaking point?
As the state’s economy faces headwinds, California’s state and local governments are consuming a growing share of resources while accumulating staggering levels of debt. This report, the California Government Revenue and Debt Study, provides a comprehensive analysis of the fiscal health of California’s public sector for the fiscal year ending June 30, 2024.
Our analysis finds that California’s non-federal public sector entities collected $828 billion in revenue in FY 2024—consuming 20.6% of the state’s entire Gross Domestic Product (GDP). Despite this massive intake of taxpayer funds, total long-term debt has ballooned to $1.37 trillion, or 34.1% of state GDP.
A primary driver of this fiscal fragility is the influence of government unions, which have secured expensive pension and retiree healthcare (OPEB) packages. These unfunded commitments to government retirees—rather than traditional bonds for infrastructure—now constitute the majority of public sector liabilities.
Key Findings:
This report details the specific debt burdens of cities, counties, and special districts, and highlights the data transparency challenges—such as late financial audits—that obscure the true scale of the problem from the public.
In this study, we estimate revenues collected and debt incurred by California state and local government as of the end of the 2023-2024 fiscal year. We begin by presenting the totals we calculated, placing them in the context of California’s overall economy, and suggesting some policy implications.
In later sections, we compare this latest release to previous California Policy Center research and discuss data collection methods and challenges. We explain that limitations in state and local financial reporting make this compilation work far too difficult and suggest policy reforms that would ease the ability to measure California local government financial performance.
Having collected revenue and debt data for a large number of local governments, we can identify those that have especially high debt-to-revenue ratios. This ratio is a key indicator of government fiscal health. We describe the challenges of several local governments that have high ratios.
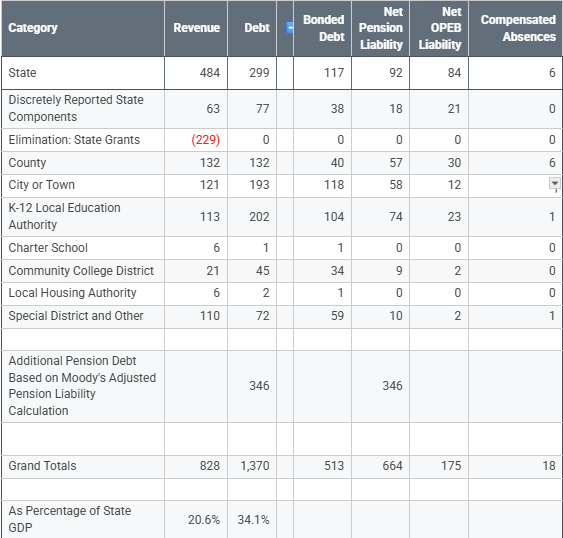
We estimate that non-federal public sector entities in California collected $828 billion of revenues in fiscal year 2024, representing 20.6% of the state’s Gross Domestic Product. Long term debt including pensions, other post-employment benefits, and compensated absences (unused sick and vacation pay) totaled $1.37 trillion or 34.1% of GDP.
State GDP was $4.014 trillion as of the second quarter of 2024. Since most of the government financial data we’ve gathered is for the fiscal year ending June 30, 2024, we use that as the quotient for our debt-to-GDP calculation.
The following table presents the revenue and debt by type of government. While most of the categories listed in the right column are self-explanatory, a couple require explanation. Discretely Reported State Components include the University of California and the California Housing Finance Agency: entities that are reported in the state’s Annual Comprehensive Financial Report but not consolidated into the state’s financial totals. To reduce double-counting, we removed (eliminated) state grants to the University of California, Community College Districts, School Districts and other entities.
As elected officials and voters consider bond and tax increase measures in 2026, one question to consider is “How much is enough”? Our finding that state and local government activity is already consuming over one fifth of California’s economy helps frame that question.
For those who prefer a government-led economy, 20.6% might seem too little, while free market proponents will say it is too much. Other Californians may gauge the cost against their view of the quantity and quality of service California governments deliver.
When government agencies ask for tax increases and bonds on the 2026 ballot, they may persuade voters that they legitimately need more money. But voters could view these requests through another lens: if California is spending 20.6% of its money on the public sector overall, yet my city, school district, or special district does not have enough money, perhaps other California government entities are collecting and spending too much money. If that’s the case, it may be better to find ways to redistribute funds between governments instead of increasing the amount they collect in aggregate.
Most of our revenue data come from the Secretary of State’s ByTheNumbers system which includes self-reported data from thousands of California local government entities. School district revenues were obtained from the EdData website.
Revenue data for the state, community college districts, and housing authorities as well as all government debt data in this report comes from audited financial statements. We collected debt in four categories: (1) traditional long-term liabilities such as bonds, loans, and leases, (2) unfunded pension liabilities, (3) unfunded post-employment benefit obligations (mostly retiree health care), and (4) compensated absences (i.e., unused vacation and sick pay),
We adjust the reported pension debt using an approach originally developed by Moody’s Investors Service. Rather than discounting future pension payments by each pension system’s assumed rate of return (generally around 7%) we apply the FTSE Pension Liability Index, which reflects yields on high quality corporate bonds. This index is often applied to private pension systems, so using it for public pension systems offers greater consistency. On the other hand, many pension reformers argue that pension payments should be discounted by the risk-free rate of interest given that the payments will certainly be made. Since there is no measurable risk of the pension payments not going out under California law, discounting them by a rate which reflects payment uncertainty seems inappropriate. While this critique is sound, the risk-free discount rate is not used in government accounting, so we have concluded that a middle approach introduced by one of the major credit rating agencies is most appropriate for our purposes. As of June 30, 2024 the FTSE Pension Liability Index stood at 5.35%.
California Policy Center has previously measured California government debt. In our last study, based on 2020 data, we estimated California public sector debt at $1.639 trillion. That estimate included $67 billion of deferred maintenance estimated by the Legislative Analyst’s Office. We exclude that value here as we confine ourselves to estimating debt components included in Government Accounting Standards. On the other hand, we are including $16 billion of compensated absence liabilities not included in the previous analysis.
These differences are relatively small and do not explain the large drop in reported debt. The main reason for the change is the increase in interest rates between 2020 and 2024. We are using the FTSE Pension Liability Index to discount pension liabilities. The index which roughly tracks rates on AA-rated corporate bonds rose from 3.15% in June 2020 to 5.35% in June 2024. Due largely to this change in interest rates our adjustment to reported pension liabilities declined from $584 billion in the previous analysis to $349 billion in the current analysis.
This is our first effort to estimate aggregate public sector revenue. However, the Census Bureau provides these estimates as part of its Annual Survey of State and Local Government Finances. The Bureau’s latest available estimate of California government revenue is for the 2023 fiscal year, when it was $708 billion. This is substantially below our estimate of $828 billion. Although there was likely some increase in overall spending between 2023 and 2024, much of the discrepancy is likely explained by the fact that the Census Bureau uses a more restrictive definition of a government entity than that employed by the California State Controller, whose data we largely rely upon (we supplement SCO data with revenues from K-12 school districts, community college districts, charter schools, and housing authorities from audited financial reports and other sources). We plan to perform a detailed comparison of Census and Secretary of State data in a future report.
As mentioned above, we used audited financial statements or Annual Comprehensive Financial Reports (ACFRs) for some of the revenue data and all of the debt data described in this report.
Collecting data from ACFRs required us to deal with these three problems:
In the following sections, we discuss these problems and suggest policy reforms to ameliorate them.
Lack of a Comprehensive ACFR Repository
There is no state-level repository that provides all California local government financial statements. Consequently, we needed to visit a large number of websites to search for ACFRs and undoubtedly missed some.
Best practice states maintain a single website containing all audited financial statements for their local governments. Examples of these resources are as follows:
| State | Location of ACFR Repository |
| Florida | https://logerx.myfloridacfo.gov/LogerX/PublicReportsMenu |
| Illinois | https://illinoiscomptroller.gov/constituent-services/local-government/local-government-warehouse |
| Michigan | https://treas-secure.state.mi.us/documentsearch |
| Ohio | https://ohioauditor.gov/auditsearch/search.aspx |
| Utah | https://reporting.auditor.utah.gov/searchreports/s/ |
| Washington | https://sao.wa.gov/reports-data/audit-reports |
Although California is larger than these other states, the job of collecting and displaying all ACFRs is not necessarily more complicated. Census data show that Illinois has more governmental units than California, while Ohio has almost as many.
California has made some steps in the direction of greater local government financial transparency, but they have not been sufficient. The Controller’s ByTheNumbers website does not display audited financial data, and, in preparing this report, we found some significant discrepancies between the data on this website and local government ACFRs. One extreme example is the San Diego Metropolitan Transit System. ByTheNumbers reports $120 million of revenue for this entity in FY 2024 while its ACFR shows a total of $574 million.
In conjunction with previous ballot measures that imposed and extended income tax surcharges to support education, SCO created a website that included links to audited financial statements for K-12 and Community College Districts. This resource can be found at https://trackprop55.sco.ca.gov/. Unfortunately, in recent years, SCO has not been adding links to new financial statements from these entities on a timely basis.
Lack of Standardized Presentation
Audited financial statements present debt data in a variety of ways. In some cases different categories of debt are shown in the entity’s Statement of Net Position, while, in other cases, it is presented in Notes to the financial statements.
To obtain comparable figures across entities it is necessary for an analyst to manually review each ACFR and record standardized data in a spreadsheet. A better approach would be to replace PDF-based ACFRs with machine readable financial statements using eXtensbile Business Reporting Language (XBRL) and adhering to a standard taxonomy. This would enable full automation of the data collection process, saving time and reducing the scope for human error.
While Florida has taken initial steps to migrate to machine-readable financial reporting, California has declined to do so twice. In 2019, Governor Newsom vetoed SB 598 (Moorlach), a bill that would have created a commission to explore applying XBRL to local government financial reporting. In 2025, a State Senate committee stripped a provision from SB 595 (Choi) which would have instructed the State Controller to investigate this technology. It is disappointing that California, the nation’s leader in technological innovation, shrank away from adopting a modern financial reporting technology.
At the national level, the Government Accounting Standards Board has launched a project to develop a standard taxonomy that could be applied to machine-readable ACFRs.
Late Filing
Government entities that have an audit requirement must typically produce their audited financial statements within six to nine months of fiscal year end. Since almost all government entities have a fiscal year ending on June 30, almost all 2024 ACFRs should have been available for analysis by March 31, 2025. But many missed that date and a substantial number still had not filed by November 2025 when we were finalizing this report. A list of tardy municipal filers can be found below.
11% of California’s cities don’t have FY2024 audited as of mid-November 2025
| Cities with FY2023 as latest audit year | Cities with FY2022 as latest audit year |
| Adelanto, Alturas, Bakersfield, Banning, Blue Lake, Bradbury, Calistoga, Ceres, Clearlake, Compton, Escalon, Fillmore, Fowler, Gonzales, Gustine, Imperial, Jurupa Valley, Kerman, La Mesa, Lindsay, Marysville, National City, Needles, Oakdale, Parlier, Placerville, Redondo Beach ,Rolling Hills, Santa Maria, Santa Paula, Solvang, Susanville, Union City, Villa Park, Williams, Willits, Winters, Woodland | Apple Valley, Brisbane, Davis, Dorris, Guadalupe, Hollister, Loyalton, Montague, Nevada City, Orange Cove, San Joaquin, Sanger |
The absence of timely reporting reflects not merely administrative delay but a deeper shift toward complacency within California’s local government financial culture. Filings on the Electronic Municipal Market Access system provide some indication of the trend toward more tardy filings. A decade ago, California municipal bond issuers posted roughly 75 late-audit notices on EMMA; by 2023–24, the figure had grown to approximately 300. While some large issuers file multiple notices, the direction is unambiguous: what was once an exception is becoming standard practice, eroding transparency for taxpayers and investors.
Delayed audits undermine fiscal oversight in several ways. Without current audited data, it becomes significantly harder to identify emerging deficits, cash flow stress, or inappropriate inter-fund transfers. Municipal budgets adopted only months after fiscal year-end are effectively built on partial information when the prior year is not closed, introducing errors that can lead to excessive spending or inadequate reserves. These lags also create compliance and market risks. Under municipal securities disclosure rules, persistent lateness signals governance weaknesses and can increase borrowing costs.
The rise in late filings reflects a combination of factors. New GASB standards governing leases, subscription software, pension reporting, and retiree health benefits have increased the complexity of local accounting. Many cities are simultaneously converting financial systems, slowing reconciliations. Staffing constraints exacerbate these pressures; small finance departments with aging software and limited expertise cannot easily absorb shocks such as employee turnover or new reporting mandates. Finally, there are effectively no consequences for tardiness.
State and federal governments should impose consequences on local governments that fail to file their audited financial reports in a timely manner. In California, SB 595 (Choi) of 2025 took a step in this direction, but was watered down in committee. As originally written, the bill would have imposed a mandatory penalty on local governments that filed Financial Transaction Reports (FTRs) more than ten months after fiscal year end. As signed, the bill allows the State Controller to waive the ten month deadline. It is also worth noting that unaudited FTRs are different from ACFRs, so even if the bill passed in its original form, its benefits would have only been indirect.
By collecting both debt and revenue data on a large number of entities, we can calculate debt-to-revenue ratios, a good measure of relative fiscal health. In this section, we look at a few California governments that have especially high debt-to-revenue ratios, emphasizing pension, OPEB, and Compensated Absence liabilities. These categories place direct expense pressure on the entity over the long-term, whereas debt service payments for general obligation bonds are often collected directly from property taxpayers. Although it appears on the entity’s balance sheet, these GO bonds do not necessarily factor into the organization’s budgeting decisions.
Sacramento Metropolitan Fire Department (Metro Fire)
Serving 720,000 people across 359 square miles, Metro Fire is one of the largest standalone fire departments in California. Since firefighters usually receive the best retirement benefits among public sector employees, an entity which primarily employs firefighters can be expected to have especially high retirement liabilities.
In FY 2024, Metro Fire’s combined pension, OPEB, and compensated absence liabilities of $836 million was more than 2.5 times district revenue. Although the district offers standard CalPERS pension benefits, it has more retirees collecting benefits than active employees contributing to the plan.
Retirees with 20 years of service can get 100% of their health insurance premiums covered by the district. Firefighters can retire and start receiving this benefit as early as age 50 meaning that they can get 15 years of insurance coverage before becoming eligible for Medicare. To Metro Fire’s credit, it has been contributing to the California Employer’s Retiree Benefit Trust (CERBT) Fund, an irrevocable trust established to fund retiree benefits.
With respect to Metro Fire’s compensated absence liability, firefighters can accrue the equivalent of about two months of unpaid vacation leave and unlimited sick leave. All unused vacation pay and 40% of sick pay is paid out in cash at retirement and the remaining unused sick pay is translated into service credits used to calculate pension benefits.
San Luis Obispo County
San Luis Obispo County has an unusually high ratio of long-term benefit liabilities and bonded debt relative to annual revenues. In FY 2024, the County’s combined bonded debt, pension, OPEB, and compensated absence liabilities of $1.6 billion was almost two times its revenue, an unusually high leverage position for a general-purpose county government. Very little of the bonded debt took the form of General Obligation bonds meaning that debt service directly impacts the County budget.
A primary driver of SLO County’s high debt load is its independent pension system, the San Luis Obispo County Employees Retirement Plan, which was only 62.98% funded. Because investment returns have not fully matched actuarial expectations, the plan’s accrued liabilities have grown faster than assets, rendering its funded ratio well below that of CalPERS and some other County sponsored pension systems. Furthermore, the County’s workforce includes large public safety, health, and human services departments with long tenures and benefit-rich Tier 1 formulas, contributing to a rising pension liability per employee.
The County has long relied on lease revenue bonds and certificates of participation to finance major capital projects — including an animal services facility, the co-located emergency dispatch center, transportation infrastructure, and the Los Osos Wastewater Project. This has resulted in elevated bonded debt levels.
Los Angeles County
In FY 2024, LA County’s combined debt, pension, OPEB, and compensated absence liabilities of $56 billion was almost 1.5 times county revenue.
A major driver is the county’s exceptionally large retiree population. The County’s OPEB program alone covers 83,633 retired members and survivors for medical benefits, plus another 28,274 spouses and dependents, totaling over 111,000 covered retirees when including dental/vision enrollments. Combined with 75,388 active vested employees and 9,612 inactive vested members, Los Angeles County’s retiree healthcare plan serves 168,633 eligible participants, larger than the population of many medium-sized cities. This scale means even modest per-capita benefit commitments translate into very large liabilities.
OPEB liabilities are also elevated because retiree healthcare was historically funded on a pay-as-you-go basis, and although the County now contributes heavily to its OPEB trust, over $760.6 million in FY 2024, plus $503 million in prefunding contributions, the liability reflects decades of unfunded accruals.
The County also provides generous healthcare subsidies, particularly under Tier 1 rules, with subsidies rising up to 100% of benchmark premiums for retirees with 25 years of service. Retirees are also reimbursed for Medicare Part B premiums, which cost the County $101.48 million in FY 2024 alone. These open-ended healthcare commitments create long-duration liabilities sensitive to healthcare inflation and actuarial assumptions.
Pension liabilities are similarly driven by the County’s scale. 80,078 active employees participate in the main county pension plan, plus tens of thousands of retirees and beneficiaries, all supported by employer contribution rates reaching 31–42% of payroll for many tiers. Although LACERA remains well-funded (83.48% funded ratio), even strong funding cannot fully offset the effect of a massive retiree base and relatively generous formulas.
City of Hayward
Hayward’s Net Pension Liability of $531 million significantly exceeds the city’s annual revenue. The city’s relatively high pension debt burden does not arise from any difference in its benefit plans, which follow CalPERS standards. Instead, Hayward is challenged by the need to support a large number of retirees. As of June 30, 2024, the City reported 1,523 retirees receiving benefits, which is one retired employee per 104 residents. Hayward also provides retiree health benefits and has a significant compensated absence liability.
Hayward’s debt burden is contributing to a larger municipal fiscal crisis, which CPC Senior Fellow Mark Moses described in a recent post on our website.
City of San Gabriel
San Gabriel’s balance sheet is dominated by retirement obligations relative to its modest revenue base. In FY 2024, City of San Gabriel’s combined debt, pension, OPEB, and compensated absence liabilities of $144 million was over 2 times city revenue. OPEB and pension liabilities account for almost 96% of these obligations. The OPEB plan’s total retiree health liability is $51.5 million, offset by only $7.2 million in trust assets. On the pension side, at the current 6.90% discount rate, CalPERS estimates $23.1 million of net liability for miscellaneous employees and $65.6 million for safety employees.
These magnitudes reflect both benefit design and scale. San Gabriel is a full-service city with its own police and fire departments; safety members earn formulas up to 3% at 50, with employer normal-cost rates above 29% of payroll plus more than $5.1 million per year in unfunded-liability payments for police and fire plans combined. The OPEB plan covers 319 people (184 active employees and 135 retirees/beneficiaries) and can pay up to the full CalPERS medical benchmark for employees with 20+ years of service.
City of Bell Gardens
Bell Gardens carries unusually large retirement obligations relative to its modest revenue base. In FY 2024 the City reported a net pension liability of $53.28 million (split between $19.83 million for miscellaneous employees and $33.45 million for safety) and a net OPEB liability of $68.62 million. Combined, unfunded pension and retiree-health promises exceed $120 million with a further $12 million liabilities from debt and compensated absences. With total government-wide revenues at only about $66 million, these liabilities are roughly 2 times annual revenue.
The core driver is benefit design in a very labor-intensive city. Bell Gardens is a full-service municipality with its own police department; safety employees earn CalPERS formulas as rich as 3.0% at 50, while pre-PEPRA miscellaneous employees receive up to 2.7% at 55. Employer contribution rates reach 25.64% of payroll for classic safety and 14.03% for classic miscellaneous, plus separate payments on the unfunded accrued liability. These rich formulas, layered on a small payroll and tax base, produce a large stock of promised pension benefits.
OPEB liabilities are even larger. The City provides retiree medical, dental and vision coverage, paying premiums on a pay-as-you-go basis for 160 active employees and 75 retirees (235 participants total). With a total OPEB liability of $68.94 million financed by only $0.33 million in plan assets, almost the entire amount sits as net liability. Rising healthcare costs, a low 3.65% discount rate, and decades of under-prefunding all magnify these retiree-health promises relative to the City’s revenue.
Despite collecting a large amount of revenue, California state and local governments have accumulated a large volume of debt. Most of this debt does not take the form of traditional bonds, leases, and loans. Instead, it arises from unfunded commitments made to government employees. These unfunded benefits are often the result of public employee unions triumphing at the negotiating table against agency management, which too often fails to represent the interests of today’s taxpayers let alone those of future taxpayers.
Revenue and debt vary greatly across local governments. Those that have high ratios of debt to revenue are at heightened risk of financial distress. While observers across the political spectrum may differ on the question of “how much revenue is enough overall,” all of us should be interested in where debt and revenue are concentrated.
Marc Joffe is a visiting fellow at California Policy Center.
The author would like to thank CPC interns Athan Joshi and Courtney Nguyen for helping research this report.