
Several Inland Empire Cities Make Big Moves in 2020 Financial Rankings
The pandemic lockdown started in the last quarter of the 2019-2020 fiscal year, so what kept the majority rather steady and the rest either improving dramatically or in decline?
This report provides one key number, the city’s unrestricted net position for governmental activities. This is calculated by reducing the city’s assets by its liabilities and restricted funds. In most instances, the ACFR will also provide the city’s population. If not, several census sources are available online to obtain this number.
Dividing the unrestricted net position by the city’s population provides an amount useful for comparison purposes with neighboring cities. The graph below provides the big picture. It would be good for a city to be in positive territory. While half of the cities accomplished this, four dropped into negative territory. It would also be good for a city to move up in the rankings on a steady basis year after year. But 2020 saw three cities make big drops. Let’s discuss them first.
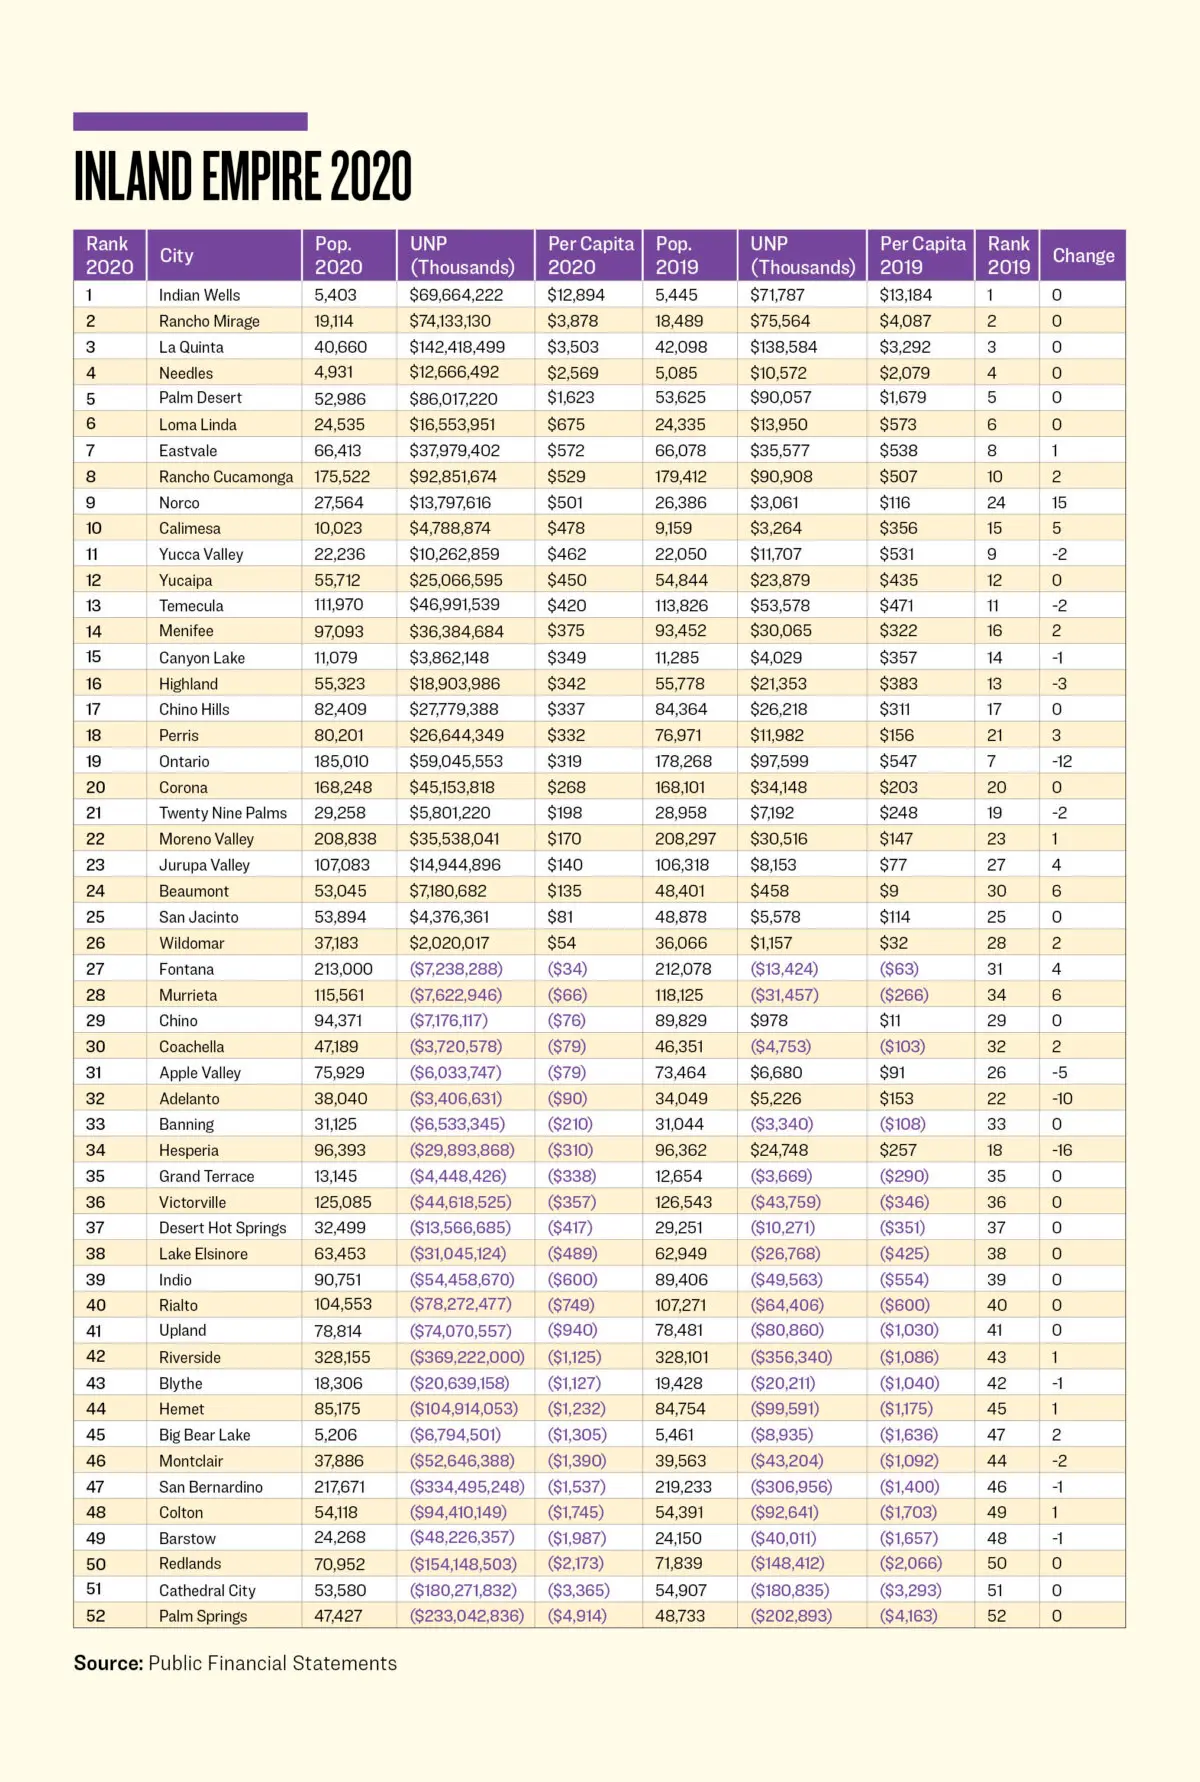
The city of Hesperia dropped sixteen places by a significant reclassification. It reduced its unrestricted net position by creating $64 million in restricted assets overnight for the following five categories: transportation, air quality, public safety, economic development, and other. The city of Adelanto dropped ten places the old-fashioned way, spending $9.5 million more than it received in revenues, explaining the reduction of $8.6 million to its unrestricted net position.
The city of Ontario saw its population increase by 6,742, nearly four percent, which would normally positively impact a per capita calculation. But, with its unrestricted net position dropping by nearly $39 million, this would not be the main story. Besides the Governor shutting down the state, this city had plenty on its plate.
With the proceeds, Ontario also added nearly $101 million in available cash funds to reduce its defined benefit pension plan unfunded actuarial accrued liability by a total of $337,485,564. But, except for the additional funds, it still has the same amount of overall pension debt. It now has a significant annual obligation to pay bondholders, as well as the pension system.
Ontario also made a unique move of reclassifying an investment category from governmental activities to business-type activities. This move can explain the bulk of the drop, as the transfer was for $47 million. The city also increased its capital assets by $61 million. After all this activity, Ontario dropped 12 places.
Let’s look at the cities that moved up the rankings. The city of Norco jumped up 15 places by doing the opposite of what the city of Hesperia did, it reduced its restricted assets by $6.85 million, explaining the bulk of its $10.7 million increase in unrestricted net assets.
The city of Beaumont saw its population grow by 9.6 percent in one year, while the region dropped its overall population by 6.4 percent. It moved up six places by following the same strategy of the city of Norco, reducing its restricted assets by $7.2 million and increasing its unrestricted net assets by $6.7 million.
The city of Murrieta also moved up six places. Most of the $23.8 million reduction in its unrestricted net deficit was from two sources. The first is from revenues that exceeded expenditures by $8 million. The second is the Norco and Beaumont strategy, Murrieta reduced its restricted assets by $10 million.
The best strategy is to keep expenditures lower than revenues and using the difference to reduce debts. Of course, reducing the amount of restricted assets helps, but this is more of an accounting maneuver.
The top city in the Inland Empire, by far, continues to be Indian Wells. It was one of the top cities in the Golden State based on the statewide rankings I published in 2019 while serving in the state Senate. They were so flattered, they made a mention of it in their 2020 ACFR:
“Today, Indian Wells has a capital reserve fund of $25 million, which is part of nearly $44 million in cash reserves held by the City. This fiscally conservative discipline has earned the City of Indian Wells the prestige of being the 4th most fiscally sound community in California in the Senator Moorlach Report.”
Here’s to hoping we see more cities like Indian Wells in the years to follow.
John Moorlach is the director of the CPC’s Center for Public Accountability. He has served as a California State Senator and Orange County Supervisor and Treasurer-Tax Collector. This article originally appeared in The Epoch Times.