
If You Think the Bull Market Rescued Pensions, Think Again
One year ago the Dow Jones stock index was 19,756. Today it closed at 24,211, an increase of 23%. Pretty good for one year! When the stock market does well, pension funds do well, since that’s where these funds place most of their portfolio investments. But CalPERS, the largest public employee pension system in the United States, is not doing well. Why not?
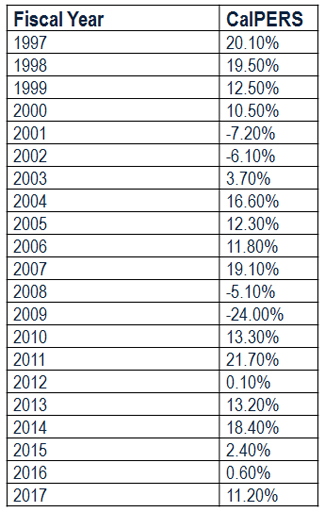
The table below shows how well CalPERS, the California Public Employees Retirement System, has performed with its investments over the past twenty years through their most recent fiscal year ended 6/30/2017.
As can be seen, CalPERS, like the stock market, and like all pension systems that rely primarily on the stock market to drive the performance of their investments, has had good years and bad years. Back in the late 1990’s, when the stock market was roaring, CalPERS put together a string of great years, including a whopping 20.1% return in 1997 and a 19.5% return in 1998. Then in 2001, after the internet bubble burst, CalPERS lost 7.2%, followed by a 6.1% loss in 2002.
A similar up/down story can be told during the stock market recovery in the mid-2000’s, where CalPERS logged a 16.6% return in 2004, 12.3% in 2005, 11.8% in 2006, and a spectacular 19.1% in 2007. Then when the housing bubble burst, CalPERS lost 5.1% in 2008, followed by a 24.0% loss in 2009. Now the stock market has turned in eight years of positive returns. What could go wrong?
CalPERS Investment Returns, 1997-2017
One could argue that stocks rise and fall unpredictably but over the long run their positive performance is reliable. This is validated by looking at the average returns for CalPERS over the past 20 years, as shown in the next chart. As can be seen, over the past 20 years, CalPERS has generated an average return of 6.58%, very close to the average they claim they can earn, currently set at 7.0%.
CalPERS Average Return Over Various Time Spans Ending 6/30/2017
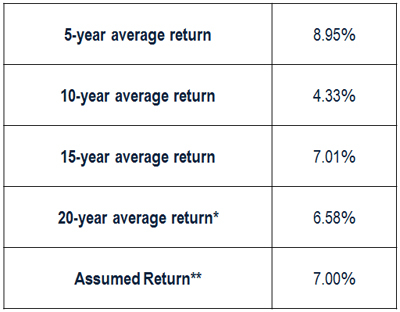
Ok, so CalPERS said they could hit 7.0% and over the last twenty years, they hit 6.58%. What’s wrong?
Actually, a lot is wrong. Here goes:
(1) It doesn’t seem like very much, but the difference between a 7.0% rate of return and a 6.58% rate of return is actually quite significant. The impact of compound interest over the multi-generational time span of pension fund investments magnifies the impact of even a small reduction in how much pension systems expect to earn. For example, the difference between 7.0% and 6.58% is 0.42%, a little less than one-half of one percent. But that 0.42% reduction increases the required annual contribution as a percent of payroll from 23.0% to 25.8% – and as a fully funded plan becomes unfunded, as will be seen, the “catch up” contributions start to pile up.
(2) While CalPERS currently assumes a long-term annual rate of return of 7.0%, back in 2001 they assumed an 8.25% rate of return (ref. CalPERS 2001 CAFR, “Economic Assumptions,” page 73). The gap between 8.25% and 6.58% is huge. If pension system actuaries predict an 8.25% annual investment return, a fully funded plan only has to receive annual contributions of 16.4% of payroll, compared to 25.8% based on a prediction of 6.58% returns. Based on this analysis, back in 2001, when CalPERS should have been collecting 25.8% of payroll, they were only collecting 16.4% of payroll.
Before all these numbers start to swim about incoherently, the next chart shows the bottom line result. Back in 1999, CalPERS had invested assets totaling $149 billion. The present value of their pension obligations to current and future retirees was estimated at $116 billion, which is to say they had a surplus of $33 billion. Put another way, their assets exceeded their liabilities by 128%. No wonder they worked with public sector unions to increase pension benefit formulas. But by 6/30/2016 – the most recent data available – CalPERS had assets of $298 billion, but they had liabilities of $436 billion. That is, they were now only 68% funded, and they had a deficit of $138 billion. The chart below dramatically illustrates this nearly twenty year decline in the financial health of CalPERS.
CalPERS Unfunded Liability by Year, 1999-2016
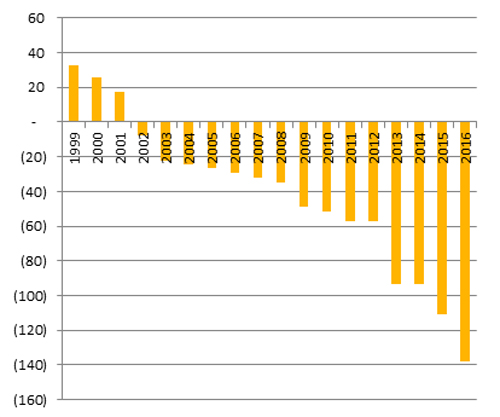
The financial challenges facing CalPERS are even worse than this chart indicates, because when a pension system is fully funded, it can much more easily absorb a few years of market losses. But despite earning 6.58% over the past 18 years, CalPERS has gone from 128% funded to only 68% funded. They have gone from having a $33 billion surplus to having a $138 billion deficit. When the investments that have soared over the past eight years endure the inevitable downward correction, CalPERS will be even more underfunded. Put another way, pension systems should be registering deficits like this at the end of a bear market, not after eight years of a bull market.
The bull market did not save the pension funds. If it had, CalPERS would have a surplus, not a $138 billion deficit.
Taxpayers, public servants, elected officials, pension fund management, public sector union leadership: Beware. Public sector pensions are not financially healthy, they are going to require higher contributions every year, and what precarious stability they do maintain is only a result of a bull market that is very long in the tooth.
REFERENCES
CalPERS Annual Report 2017 (ref. page 120 for data on funded status 2007-2017)
CalPERS Annual Report 2008 (ref. page 64 for data on funded status 2006-2002)
CalPERS Annual Report 2004 (ref. page 56 for data on funded status 2001-1999)
Graphics to Explain the Pension Crisis to Colleagues and Constituents
Explaining the Pension Crisis – Additional Graphics
Pension Questions To Ask Your Agency’s CFO, Actuary & Auditor
The source for the pension contributions required at various rates of return were calculated using the downloadable Excel spreadsheet “Pension Analysis Model.” A tutorial on how to use that model is provided in the article “A Pension Analysis Tool for Everyone.” Please note this Excel model calculates the “normal contribution” only, and does not calculate required contributions as a percent of payroll for underfunded systems.
The Coming Public Pension Apocalypse, and What to Do About It, CPC Study, 2016
Marc Joffe from the Reason Foundation contributed to this article.